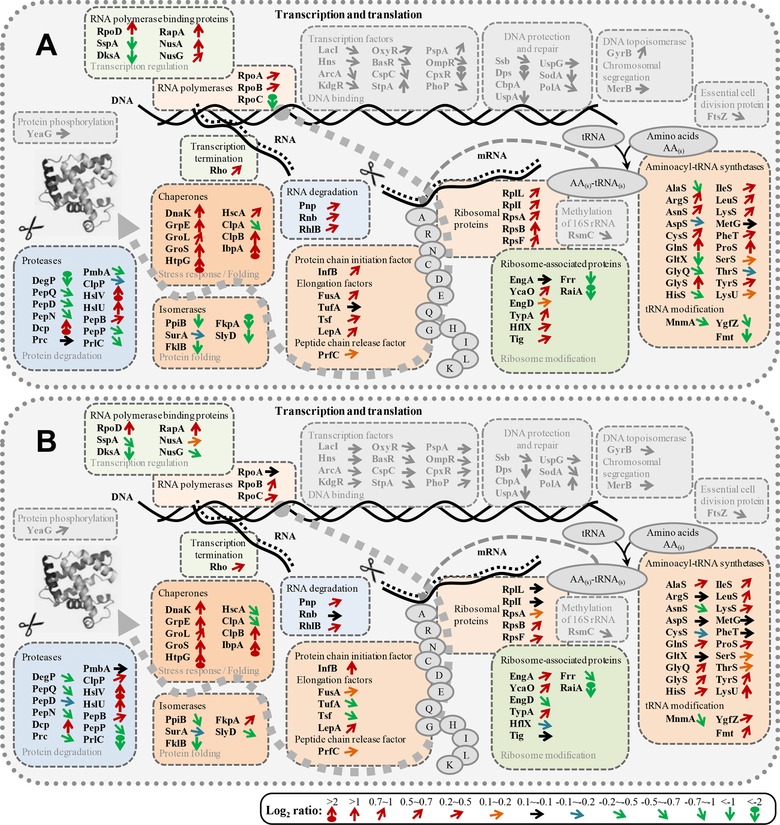
Figure 5.

Transcription, translation, and protein folding: proteomic response to hFGF‐2 production. Details of the subproteome related to transcription, translation, and protein folding of hFGF‐2 producing cells in complex (A, 3.5 h postinduction) and defined medium (B, 5 h postinduction) in direct comparison to nonproducing control cells grown under identical conditions to the same sampling time point. Differences of the single protein abundances are expressed as Log2 (producing/nonproducing) ratios using different color coded arrows for visualization [code on bottom, e.g. Log2 ratio > 2, indicated with a red circle with up‐pointing arrow signifies that the abundance of this protein is at least four times higher in the hFGF‐2 producing culture than in the respective control culture]. The entire comparative proteomic (pathway) data are visualized in Supporting Information Figs. S9–S16 and the corresponding values are given in the Supporting Information Table S1. The list of abbreviations is found at the end of the Supporting Information Fig. S16.
