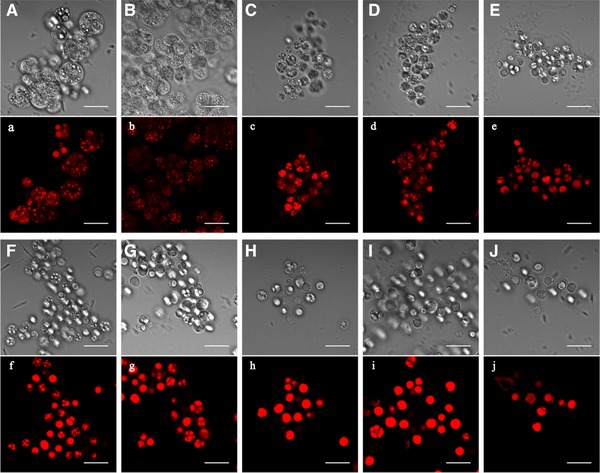
Figure 3.

Changes of light microscopic morphology in fed‐batch fermentation by Schizochytrium sp. AB‐610 detected by LSCM after Nile red staining. Cells were cultured for 12 h (A, a), 24 h (B, b), 36 h (C, c), 48 h (D, d), 60 h (E, e), 72 h (F, f), 84 h (G, g), 96 h (H, h), 108 h (I, i), and 120h (J, j). The differential interference contrast images (uppercase letters) and fluorescence images (lowercase letters) of the same cells were shown. Scale bar = 20 μ μm.
