
Figure 3.
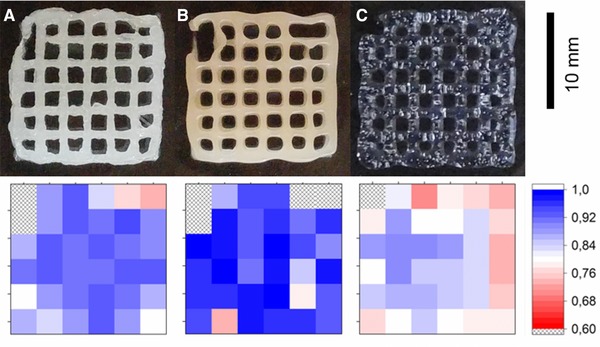
Quality control of the printed lattice structures. The upper row shows top view images of the printed hydrogels using the additives DXG (A), BMA (B), and LRD (C). The bottom row shows the shape fidelity of the comparison with the desired structure, graded with a color code. Blue shades depict a high accuracy of printing, red a low conformity. Areas with printing errors such as hydrogel‐filled pores and broken connections are marked with an “x.”