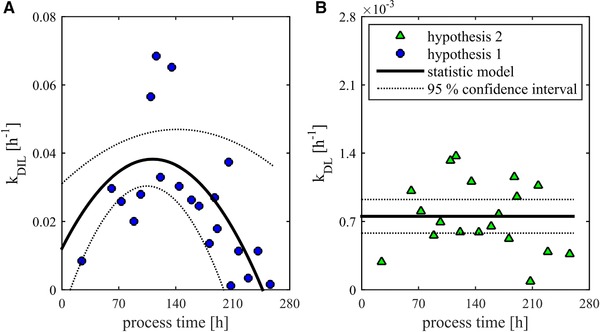
Figure 4.

The change of the lysed cell count can be described by specific rates according to previous explained hypotheses. (A) The course of k DIL—lysis rate from intact dead cells to lysed cells over the process time. In addition, the course of a significant multilinear regression (MLR) model with 95% confidence intervals is presented. (B) The course of k DL—lysis rate from viable cells (VCC) to lysed cells over the process time. Because no significant linear and quadratic effects were observed, the mean value as a constant offset is shown over the process time.
