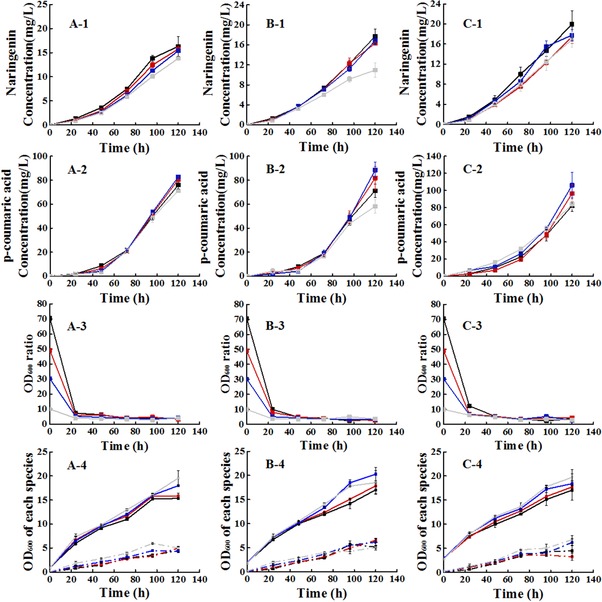
Figure 4.

Effect of inoculum size and inoculum ratio on naringenin and p‐coumaric acid fermentation. Series A represented the inoculum size OD600 = 1; Series B represented the inoculum size OD600 = 2; Series C represented the inoculum size OD600 = 3. 1 represented the naringenin yield; 2 represented the p‐coumaric acid yield; 3 represented the OD600 ratio of two microorganisms; 4 represented the OD600 of each species involved in the co‐culture system. In series 4, the solid line represented the OD600 of S. cerevisiae, and the dash dot represented the OD600 of E. coli. Line black represented the S. cerevisiae: E. coli = 70:1; Line red represented the S. cerevisiae: E. coli = 50:1; Line blue represented the S. cerevisiae: E. coli = 30:1; Line grey represented the S. cerevisiae: E. coli = 10:1. All error bars indicate ± SD, n = 3.
