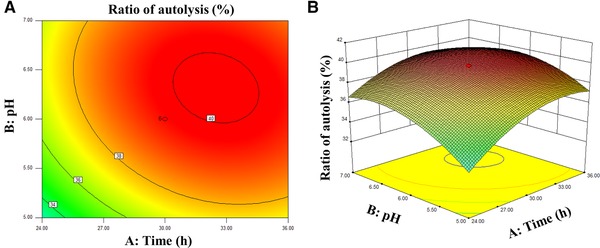
Figure 2.

The effect of time, pH, and their interaction on the ratio of autolysis. (A) 2D contour plot showing the effect of A: time (h) and B: pH on the ratio of autolysis. (B) 3D response surface plot showing the effect of A: time (h) and B: pH on the ratio of autolysis.
