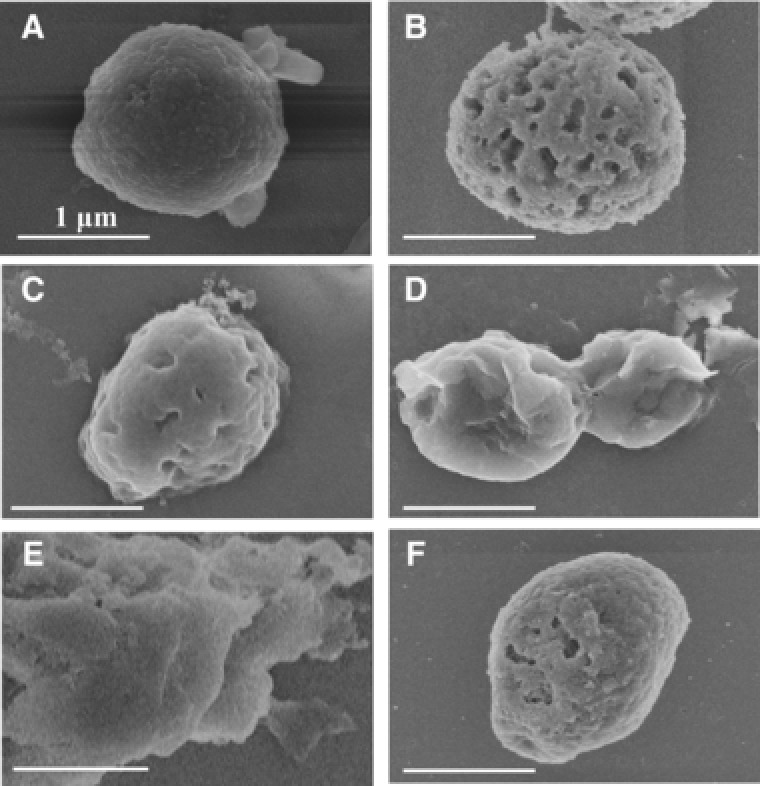
Figure 5.

Step‐wise scanning electron micrograph of P. pastoris cells at each stage of polysaccharide isolation. P. pastoris cells at each stage of the isolation were prepared and imaged by a Hitachi S‐4800 scanning electron microscope. The images were recorded at 5.0 kV. (A) Intact cells of P. pastoris before polysaccharide isolation; (B) P. pastoris cells after induced autolysis; (C) P. pastoris cells after high‐pressure hot‐water treatment; (C) P. pastoris cells after ultrasonication; (E) P. pastoris cells after isopropanol extraction; (F) P. pastoris cells inactivated by autoclaving. Bar: 1 μm.
