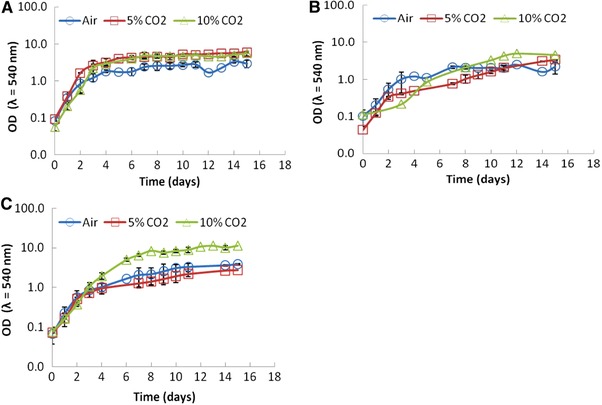
Figure 1.

Growth curves of the cultures of (A) Scenedesmus obliquus, (B) Chlorella vulgaris, and (C) Chlorella protothecoides (≈ 28°C; 74 μmol photons m−2 s−1; 1 vvm) subjected to different CO2 concentrations tested: (Air (2); 5% CO2 (2) 10% CO2 (2)). Vertical bars represent SDs between the average of two duplicates.
