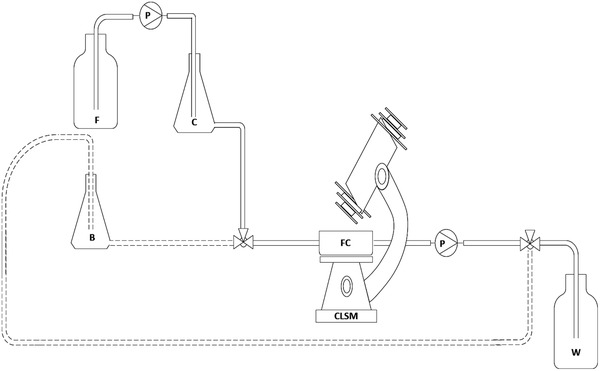
Figure 2.

P&I diagram for analysis of biofilm growth in the flow cell cultivated in batch (dotted line) and continuous process (solid line); B: batch flask; C: continuous flask; F: feed bottle; FC: flow cell; P: pump; W: waste; CLSM: confocal laser scanning microscope
