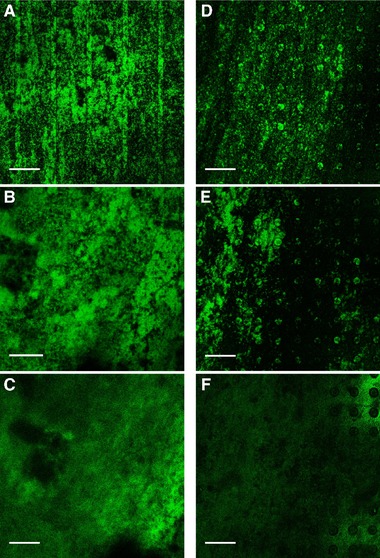
Figure 6.

CLSM images of E. coli biofilms observed for T_line2 (A‐C) and T_dot (D‐F; 100 μm interspace) after 0 h, 2 h and 6 h of continuous cultivation in flow cell, respectively. Images were taken of one distinct spot using a Leica SP5 II, HCX PL Fluotar 10x/0.3 NA dry objective. Scale bars indicate 250 μm
