
Figure 1.
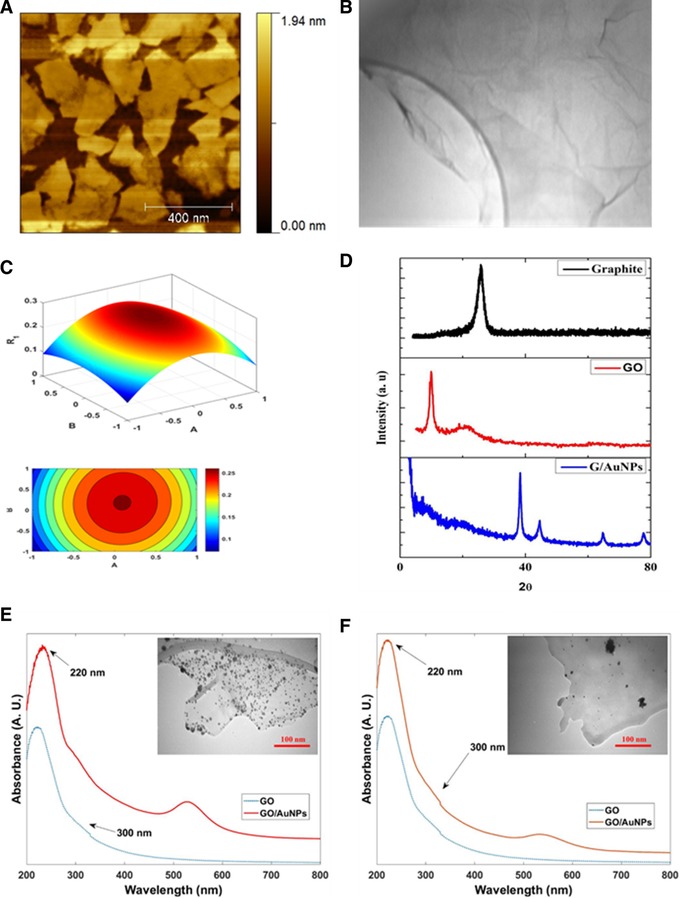
(A) AFM image and (B) TEM images of GO. (C) The 3D response surface plots for optimum condition for preparation of GO/AuNPs, and (D) XRD patterns of samples. (E) UV/Vis spectra of GO and GO/AuNPs, GO / HEPES ratio of 1 in 0.1 M of HEPES solution at time 71 min (optimum condition) and (F) GO / HEPES ratio of 1.5 in 0.1 M of HEPES solution at time of 30 min