
Figure 3.
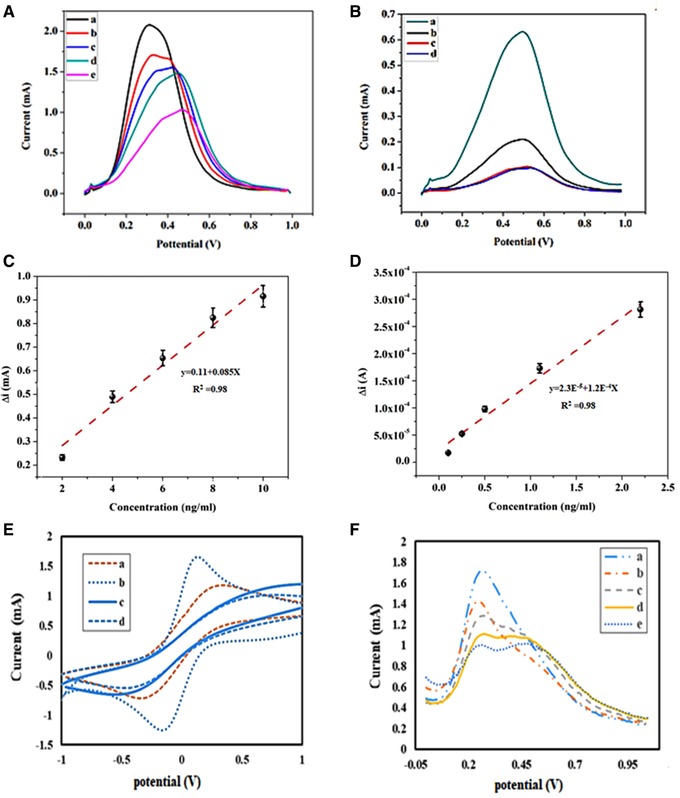
(A) SWV of G/ AuNPs /Ab1 electrode at the concentrations of 0, 2, 4, 6, 8, and 10 ng/mL of total PSA, respectively. (B) SWV of G/ AuNPs /Ab1 electrode at the concentrations of 0.1, 0.2, 0.5, 1.1, and 2.2 ng/mL of free PSA, respectively. (C) Calibration curve for the analysis of total PSA. (D) Calibration curve for the analysis of free PSA. (E) Electrochemical CV responses of bare GC electrode (a), G/AuNPs (b), G/ AuNPs /Ab1/Ag(c), and G/ AuNPs /Ab1/Ag/Ab2 (d). (F) SWV of G/ AuNPs /Ab1 electrode at the concentrations of 0, 4, 6, 8, and 10 ng/mL of total PSA, respectively