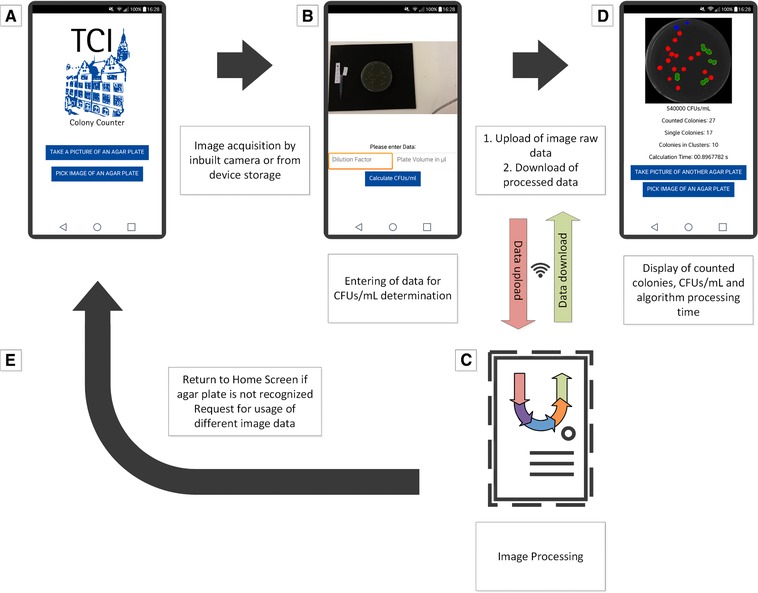
Figure 1.

Screen flow chart of the developed Android application. (A) Welcome screen and buttons for image acquisition from storage or inbuilt camera. (B) Preview of taken or selected picture, input of dilution factor and used volume for plate inoculation. (C) Data upload and image processing by server‐based algorithm and download of results. (D) Display of counted colonies and processed image, calculation of CFUs/mL. (E) Return to home screen if image data is not sufficient. Screenshots were taken from actual smartphone screens and used for the visualization with Microsoft Visio Professional 2013 (Microsoft Corporation, USA).
