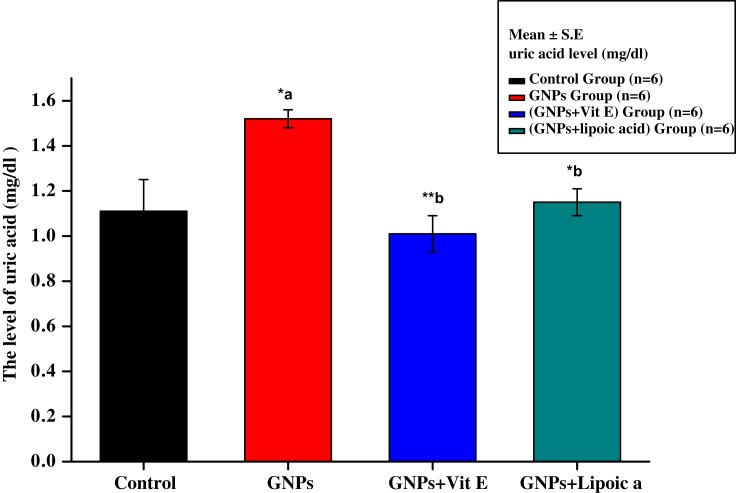
Figure 3.
Effect of GNPs, GNPs + Vit E, and GNPs + α-Lip on serum uric acid level in rats. *a represents significance between the control group and the GNPs groups (p<0.05). *b represents significance between the GNPs and the other groups (p<0.05), **b significant value p˂0.001: the data were highly significant at this value.

