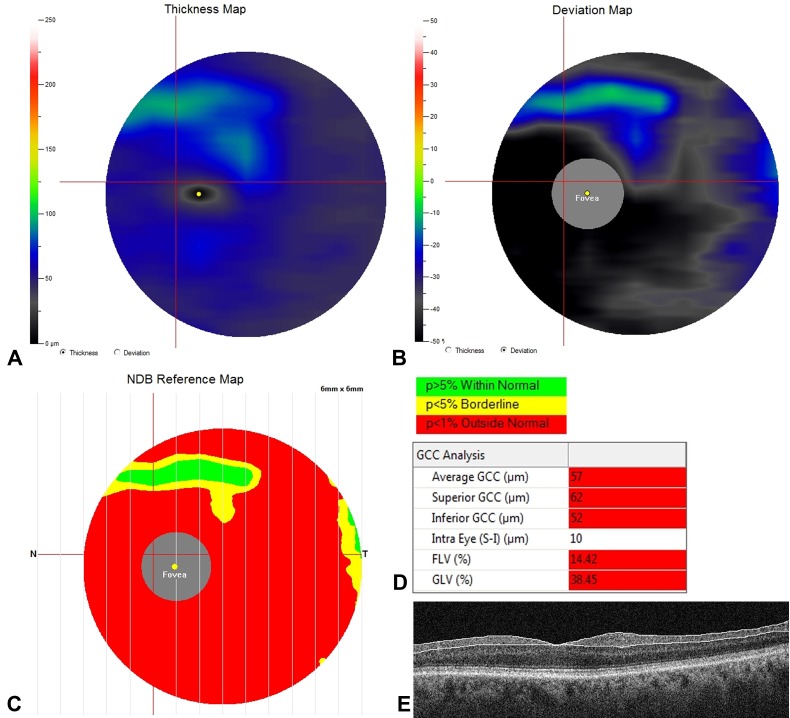
Figure 2.
Quantification of ganglion cell complex (GCC) using Fourier-domain optical coherence tomography (FD-OCT) in the case of severe glaucomatous ganglion cell loss. Three different colorimetric maps were automatically computed by the FD-OCT software (RTVue-100 software; Optovue, Inc., Fremont, CA). (A) Thickness map, displaying diffuse blue and black colors indicating severe and diffuse loss of GCC thickness. The central black spot indicates the fovea where the ganglion cells are missing. (B) Deviation map, illustrating the percentage of thickness loss with respect to the normative database. Black coloring indicates a GCC loss of 50% or greater. (C) Significance map, displaying the significant thickness change variation from normal, where green represents values within the normal range (p-value 5–95%), yellow indicates borderline results (< 5%) and red represents results outside the normal limits (< 1%); (D) Quantitative indexes calculated by the software, including average thickness, hemifield thicknesses (superior, inferior and intra-eye) and the two pattern-based diagnostic indexes (i.e., focal loss volume [FLV] and global loss volume [GLV]); (E) Cross-sectional B-scan displays the segmentation used for GCC analysis.

