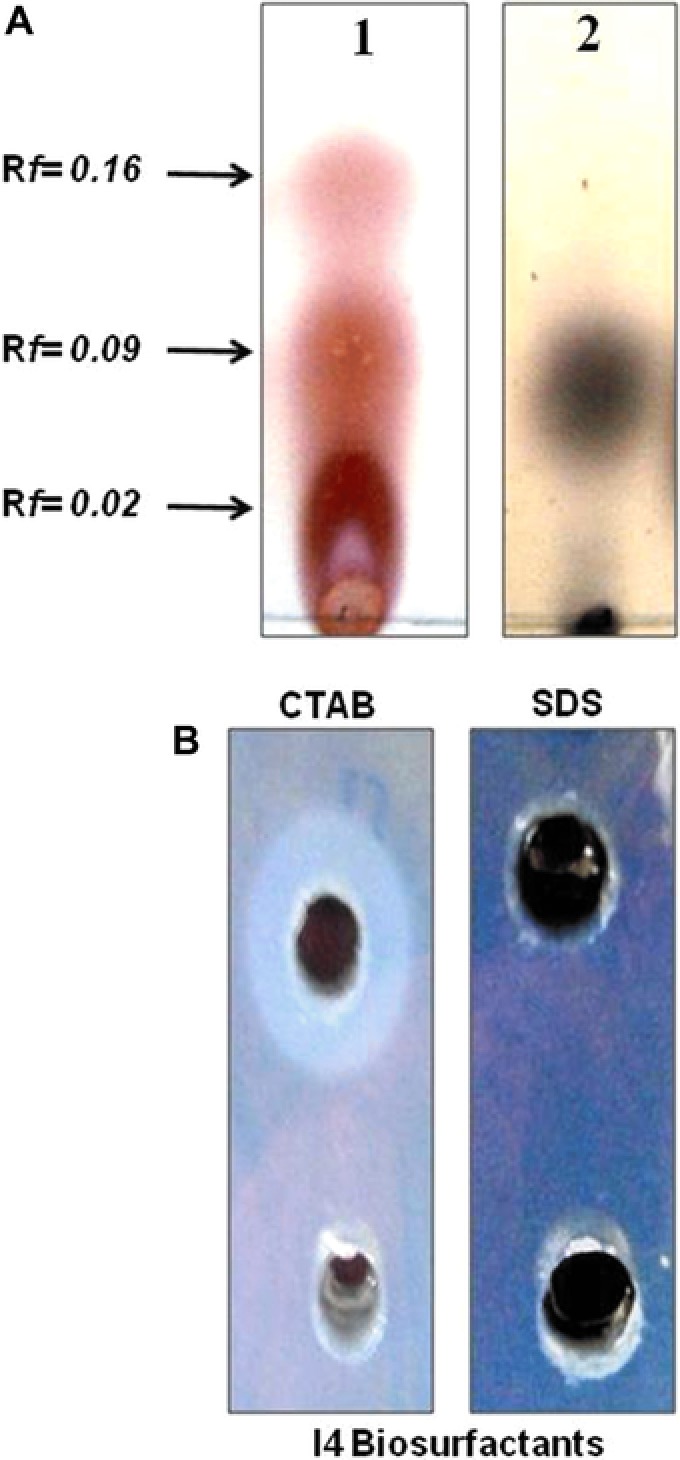
Figure 3.

(A) TLC analysis of purified biosurfactants: (1) spots stained with ninhydrin (for detection of peptides) and (2) spots stained with iodine vapor staining for lipid. The Rf values represent the retention factors for the different spots. (B) Double diffusion on agar of an anionic biosurfactant produced by B. mojavensis I4.
