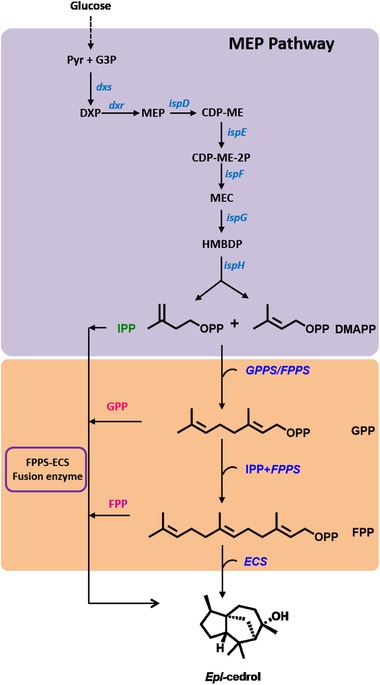
Figure 1.

Schematic diagram of MEP pathway (blue), and epi‐cedrol biosynthetic pathway in recombinant E. coli. G3P, glyceraldehyde 3‐phosphate; 3Pyr, pyruvate; DXP, 1‐deoxy‐D‐ xylulose‐5‐phosphate; MEP, 2C‐methyl‐D‐erythritol‐4‐phosphate; CDP‐ME, 4‐diphosphocytidyl‐2C‐methyl‐D‐erythritol; CDP‐ME‐2P, 4‐diphosphocytidyl‐2C‐ methyl‐D‐erythritol‐2‐phosphate; MEC, 2C‐methyl‐D‐erythritol 2,4‐cyclodiphosphate; HMBDP, 1‐hydroxy‐2‐methyl‐2‐(E)‐butenyl‐4‐diphosphate; IPP, isopentenyl pyrophosphate; DMPP, dimethylallyl pyrophosphate; FPP, farnesyl pyrophosphate; GPPS, geranyl pyrophosphate synthase; FPPS, farnesyl pyrophosphate synthase; ECS, epi‐cedrol synthase
