Figure 2.

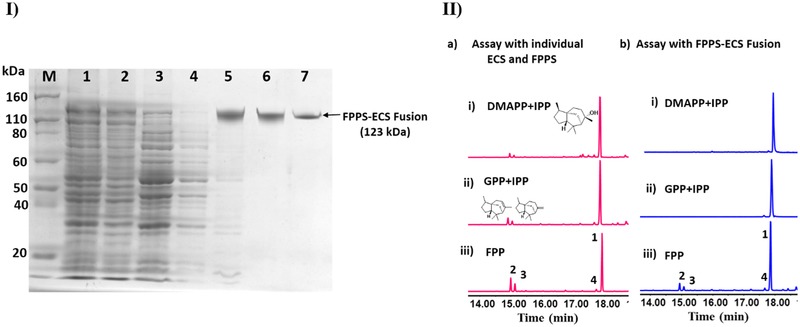
(I) SDS‐PAGE gel image of FPPS‐ECS fusion protein in which (1) crude fraction, (2) pellet, (3) supernatant, (4) 25 mM imidazole wash, (5–7) elution fractions (Purified), and (M) protein ladder (Thermo‐Fischer scientific). (II) GC‐FID chromatogram for the assay extracts: a) individual enzymes assay with substrate (i) 2×IPP+DMAPP, (ii) GPP+IPP, (iii) FPP; b) FPPS‐ECS fusion enzyme assay with substrate (i) 2xIPP+DMAPP (ii) GPP+IPP, and (iii) FPP. Products were epi‐cedrol (1), α‐cedrene (2), β‐cedrene (3), cedrol (4). Pink colour chromatograms represent the individual enzyme assay whereas blue colour chromatograms represent fusion enzyme assay
