
Figure 4.
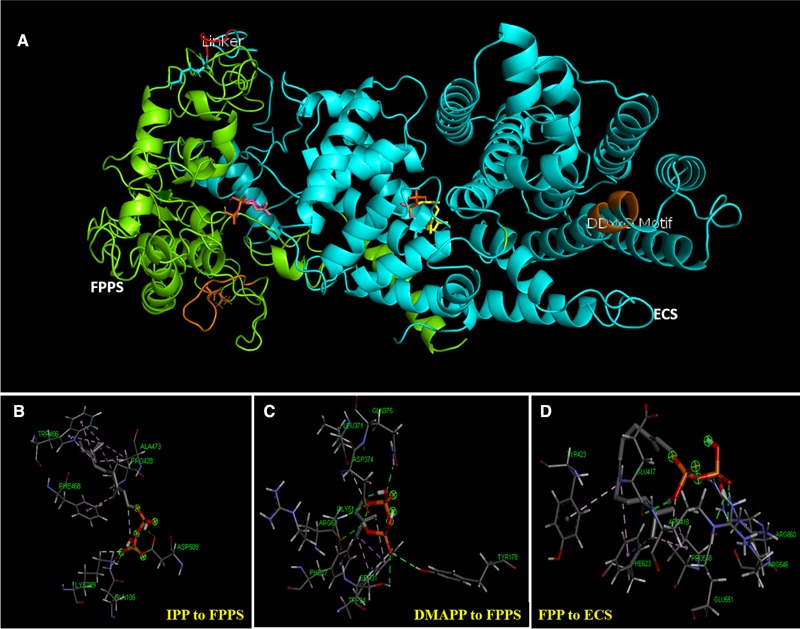
(A) Predicted structure of FPPS‐ECS fusion enzyme‐substrate complex by using I‐TASSER server and AutoDock software. FPPS and ECS were displayed in green and cyan color, respectively, while linker between two proteins was depicted in red. All the catalytic DDxxD motifs present in the proteins are displayed in orange. (B) Amino acid interactions in active pockets of FPPS enzyme with IPP; (C) FPPS enzyme with DMAPP, and (D) ECS enzyme with FPP of the fusion enzyme