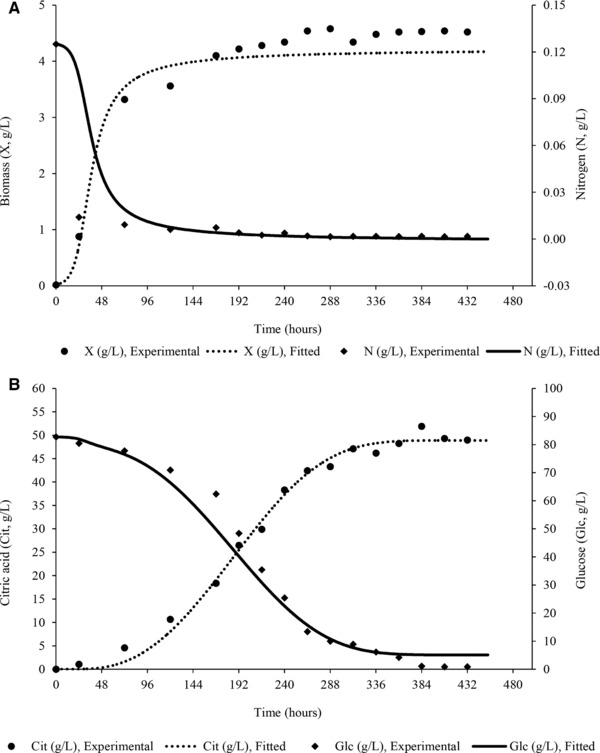
Figure 2.

Experimental values and theoretical curves concerning evolution of biomass (X, g/L), ammonium ions (N, g/L) (A), glucose (Glc, g/L), and citric acid (Cit, g/L) (B) concentration during modeling of citric acid bioprocess production by Yarrowia lipolytica ACA‐YC 5033 on OMW‐based media (shake‐flask cultures; Glc0 = 80.0 ± 2.0 g/L, (NH4)2SO4 = 0.50 ± 0.05 g/L, yeast extract = 0.50 ± 0.05 g/L; initial phenolic compounds concentration 2.90 ± 0.25 g/L) enriched with commercial glucose in nitrogen‐limited conditions. Culture conditions as described in Fig. 1.
