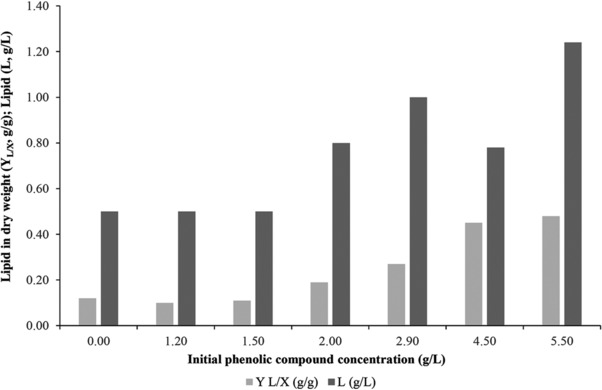
Figure 3.

Cellular lipids (L, g/L) and total cellular lipid in dry weight (YL/X, g/g) overall evolution during growth of Y. lipolytica strain ACA‐YC 5033 on OMW‐based media [initial phenolic compounds concentration 0.00 g/L (no OMW addition), 1.20 ± 0.10 g/L, 1.50 ± 0.15 g/L, 2.00 ± 0.20 g/L, 2.90 ± 0.25 g/L, 4.50 ± 0.35 g/L and 5.50 ± 0.40 g/L] enriched with commercial glucose in nitrogen‐limited conditions. Culture conditions as described in Fig. 1. Results regarding trials with initial phenolic compounds concentration 0.00 g/L (control experiment; no OMW addition), 1.20 ± 0.10 g/Land 1.50 ± 0.15 g/L obtained from Sarris et al. 22.
