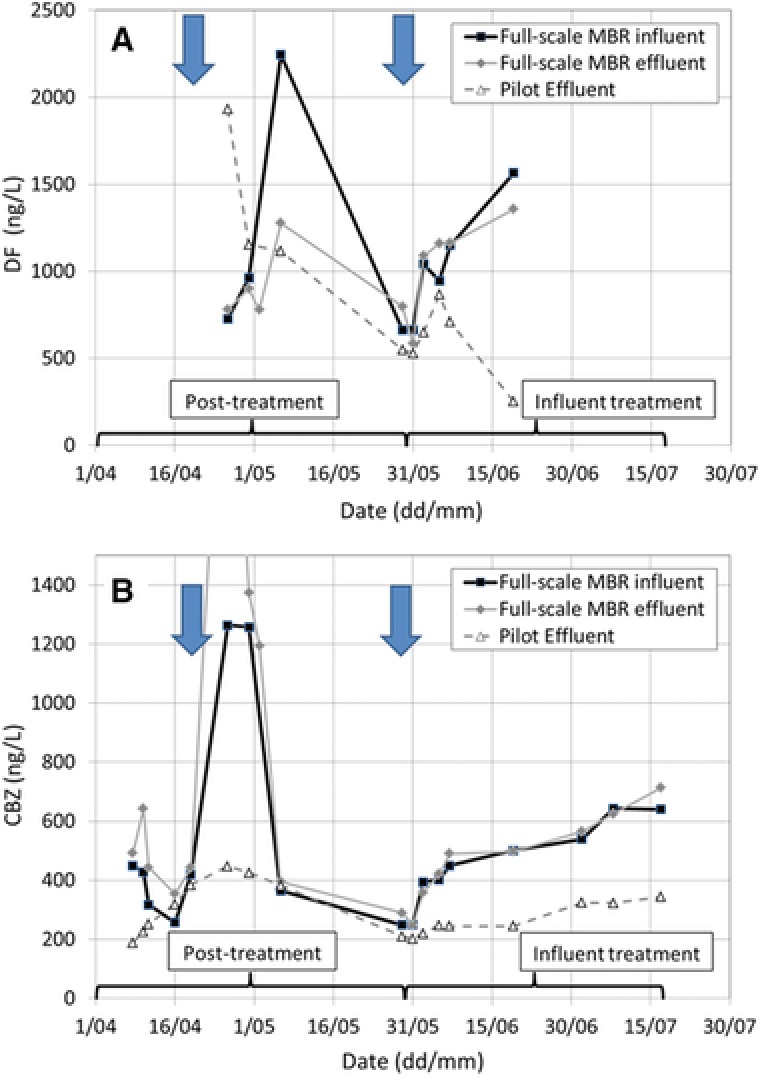
Figure 4.

(A) DF and (B) CBZ concentrations in the full‐scale MBR influent, full‐scale MBR effluent, and pilot‐scale MBR effluent during the time course of the experiment. The time periods corresponding to the use of the pilot MBR for the treatment of full‐scale MBR effluent in a posttreatment regime (posttreatment), and the use of the MBR for the treatment of raw municipal influent wastewater in a secondary treatment regime (influent treatment) are labeled. Time points of bioaugmentation of the pilot MBR with Phoma sp. are indicated by the blue arrows.
