
Figure 7.
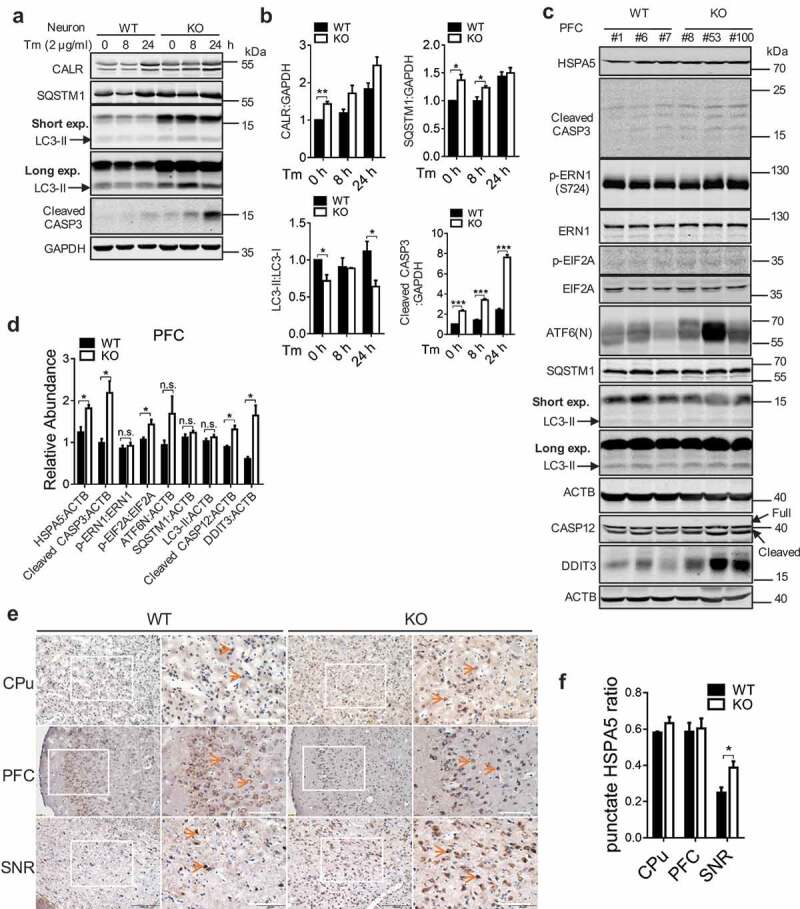
Loss of WDR45 results in increased cell death associated with ER stress. (a) Western blot analysis of CASP3 and autophagy proteins after Tm treatment in WT and KO primary neurons. (b) Bar graph shows statistical analysis of western blot data shown in (a). (c) Western blot analysis of CASP3, ER stress markers and autophagy proteins in the PFC from WT and KO mouse at 18–20 months of age. ‘Short’ and ‘long’ refer to the exposure time. (d) Statistical analysis of (c). (e) Immunohistochemistry of HSPA5 in mouse substantia nigra (SNR), prefrontal cortex (PFC), and caudate putamen (CPu) at 8 months of age. (f) Statistical analysis of (e), n = 3 per group and 3 sections per brain were used for quantification. Data were expressed as mean ± SEM (n = 3) and analyzed by two-tailed unpaired t-test. *P < 0.05, **P < 0.01, *** P < 0.001. n.s., not significant.