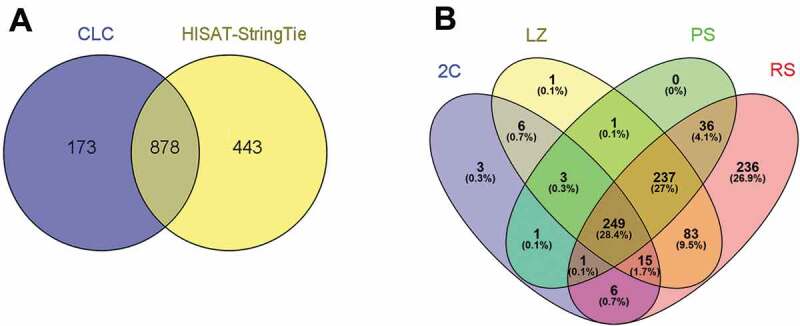
Figure 1.

LncRNA genes expressed in the four testicular cell populations. (A) Venn diagram showing the annotated lncRNA genes detected as expressed in the four cell populations with two different pipelines, and that passed all the filters. Only lncRNAs whose variance across samples was more than 1 and FPKM ≥ 0.1 in the three biological replicas, were considered. (B). Venn diagram showing the lncRNA genes expressed in each of the cell populations (2C, LZ, PS, and RS). Separate and overlapping expression between samples is shown. The considered parameters were the same as in (A).
