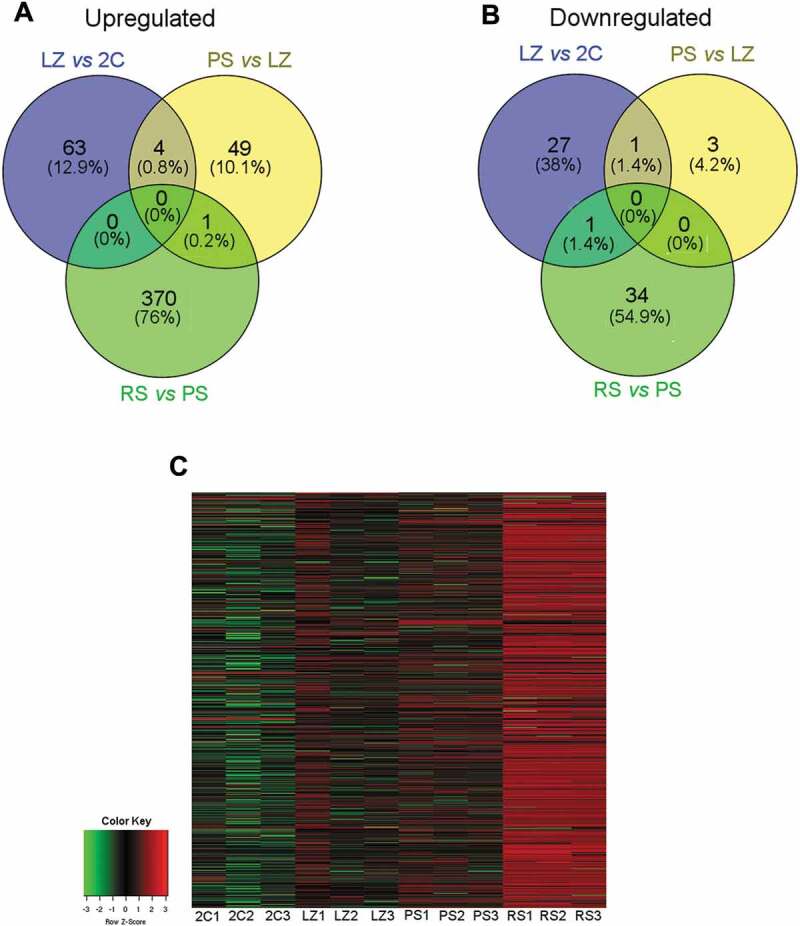
Figure 2.

Representation of the DE lncRNA genes between pairwise sample comparisons of the four testicular cell populations in chronological order along spermatogenesis. The following comparisons were performed: LZ vs 2C; PS vs LZ; RS vs PS (log2 fold-change ≥ │2│, FDR p-value correction ≤ 0.05). Only those genes whose variance across samples was more than 1 and FPKM ≥ 0.1, were considered. (A) Venn diagram of upregulated lncRNA genes between stage transitions. (B) Venn diagram of downregulated lncRNA genes between stage transitions. (C) Heat map of expression levels of lncRNA genes in the four cell populations, with three biological replicas each. All lncRNA genes detected as differential in at least one stage transition were included. Z-score values are coded on the green-to-red scale (high expression: red; low expression: green).
