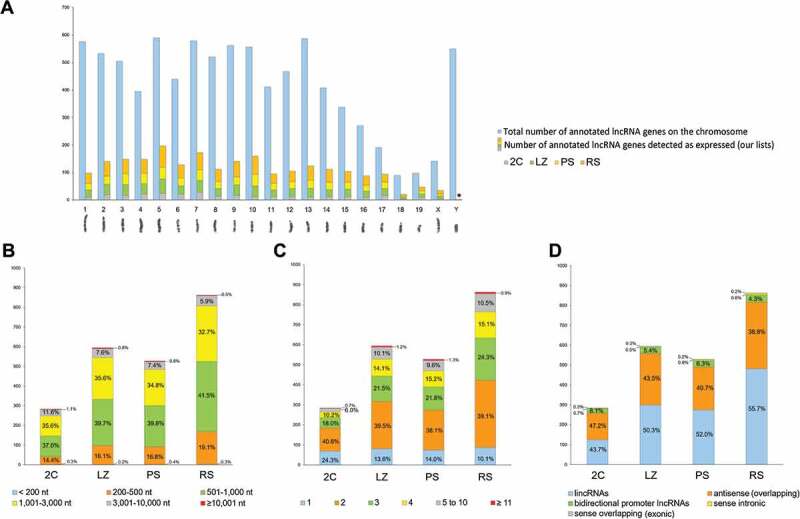
Figure 3.

Characterization of lncRNAs in the different testicular cell populations. (A) Chromosomal distribution of lncRNAs. The total number of lncRNA genes annotated for each chromosome, and the number of lncRNA genes identified as expressed per chromosome in our lists for the 2C, LZ, PS and RS cell populations are shown. A mouse karyotype is presented below the graphic, as a reference of chromosome size. *p < 10−9. (B) Length distribution of the expressed lncRNA genes in 2C, LZ, PS and RS cell populations. (C) Exon number distribution of the expressed lncRNA genes in the four testicular cell populations. (D) Biotype distribution of the expressed lncRNA genes in the four testicular cell populations.
