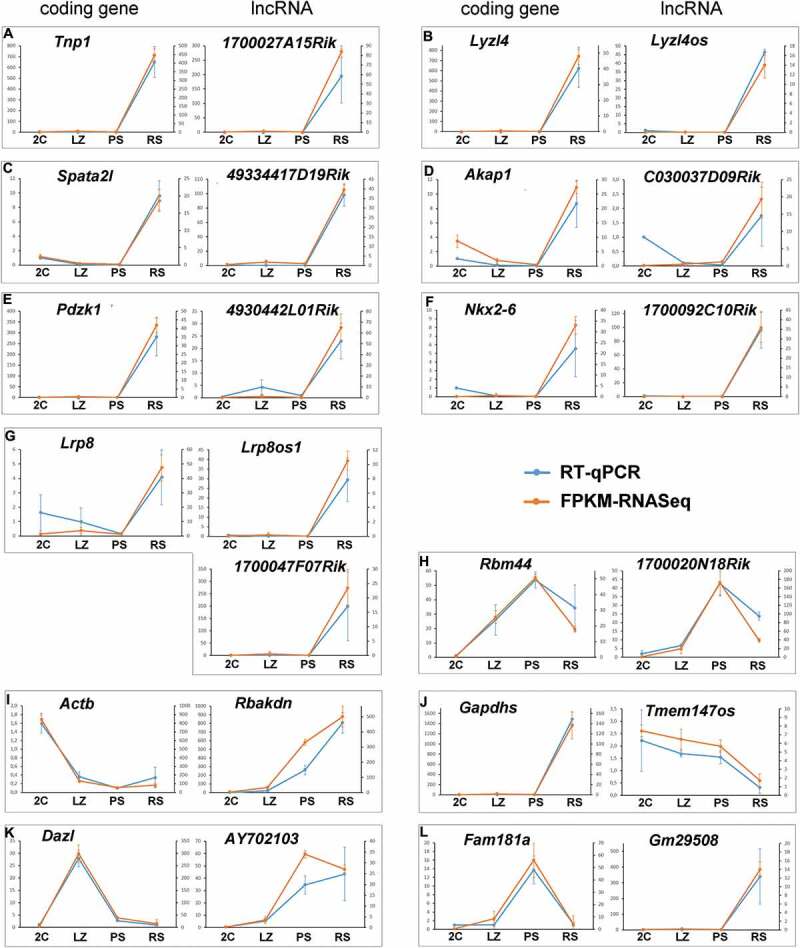
Figure 5.

Validation of the dynamic co-expression patterns of 13 selected gene pairs of lncRNAs and protein-coding genes. Gene pairs representative of the different co-expression profiles are shown. The graphics show the consistency between RNAseq data and RT-qPCR. The left axis indicates the relative quantification (RQ) of RT-qPCR, while the right axis indicates the FPKM values for RNAseq. The error bars correspond to ±SD.
