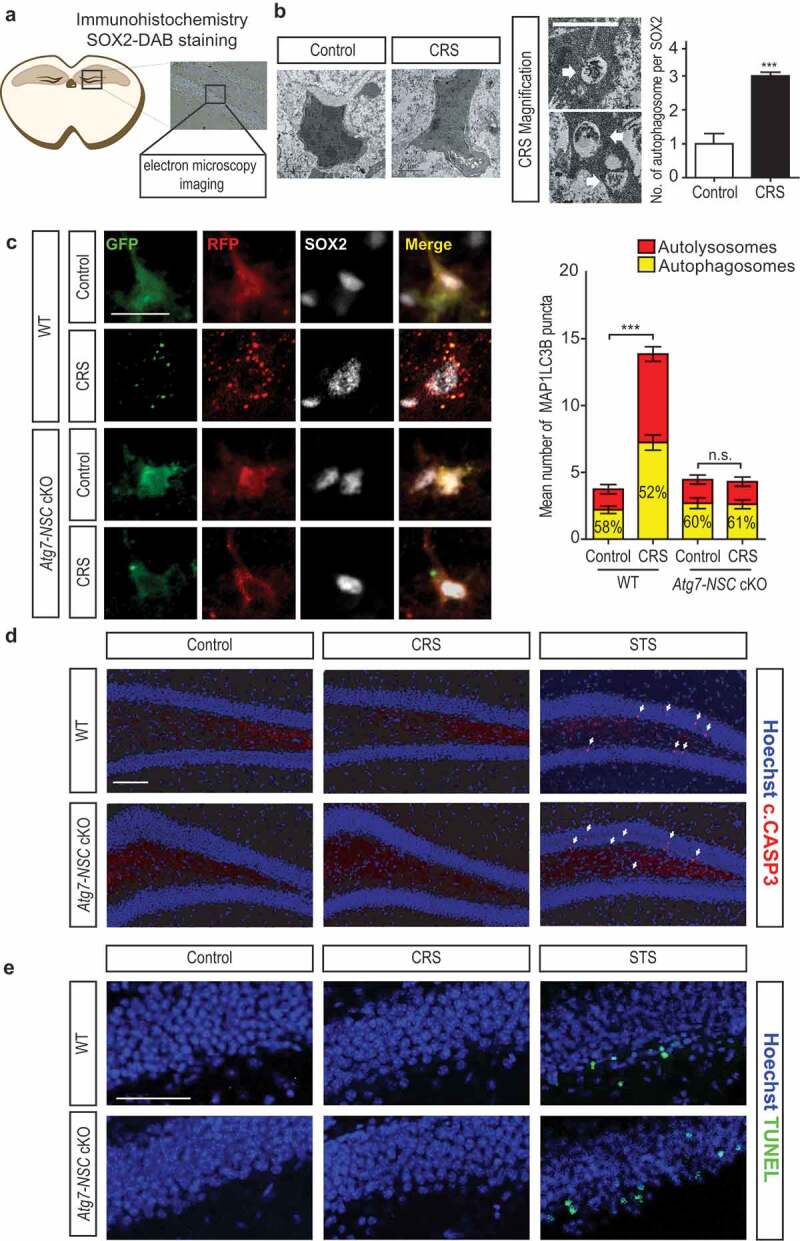
Figure 2.

CRS induces autophagy in adult hippocampal NSCs. (A) Work flow of correlative light electron microscopy (CLEM) imaging. (B) CLEM imaging of SOX2-positive cells at day-4 of CRS (n = 13 cells per group). Representative images of autophagosomes (white arrows) in CRS group are shown at higher magnification. The number of autophagosomes was counted per 5 μm × 5 μm without counting the autophagosomes of whole cells using serial sections. Scale bars: 2 μm. (C) Nes promoter-driven lentiviral expression of mRFP-EGFP-MAP1LC3B in vivo. Virus was injected 4 days prior to CRS and analyzed at day 2 of CRS. Scale bar: 20 μm. The graph on the right shows quantification of autophagosomes and autolysosomes (n = 7 or 8 cells per group). (D and E) Cleaved CASP3 (c.CASP3) staining (D) and TUNEL assay (E) in the DG at day 7 of CRS. STS was injected 12 h before analysis. Arrows indicate c.CASP3-positive cells. Scale bar: 100 μm. ***P < 0.001. n.s., not significant.
