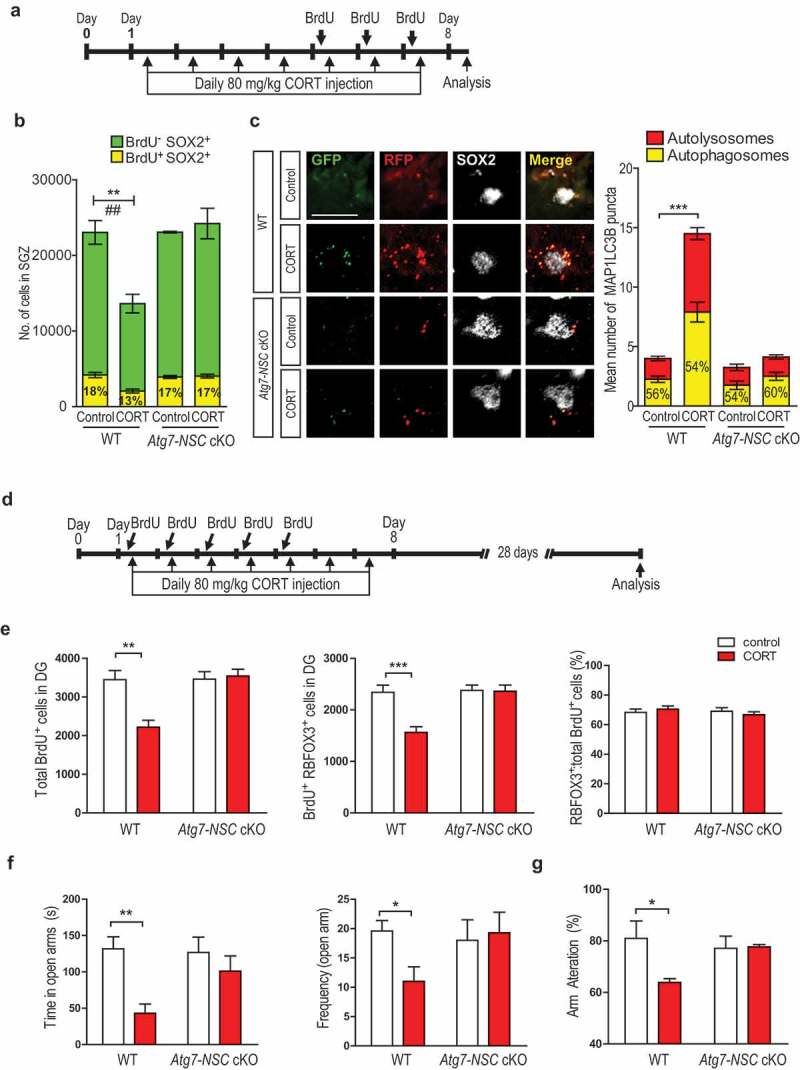
Figure 5.

CORT-induced reduction of NSC number and hippocampal dysfuction is prevented in Atg7-NSC cKO mice. (A) Timeline of the CORT injection experiment. (B) Quantification of BrdU+ and SOX2+ cells (n = 4 or 5 per group). **P < 0.01 for the total SOX2+ cells ##P < 0.01 for BrdU+ SOX2+ cells. (C) Nes promoter-driven lentiviral expression of mRFP-EGFP-MAPLC3B in SOX2+ cells in vivo. Scale bar: 20 μm. The graph on the right shows quantification of autophagosomes and autolysosomes (n = 7 or 8 cells per group). (D) Timeline for the measurement of the number of BrdU+ RBFOX3+ double–positive NSCs. (E) Quantification of BrdU+ RBFOX3+ double-positive cells (n = 4 or 5 per group). (f) Elevated plus maze test (n = 4 per group). (g) Y-maze test (n = 4 per group). *P < 0.05, **P < 0.01, ***P < 0.001.
