Figure 7.

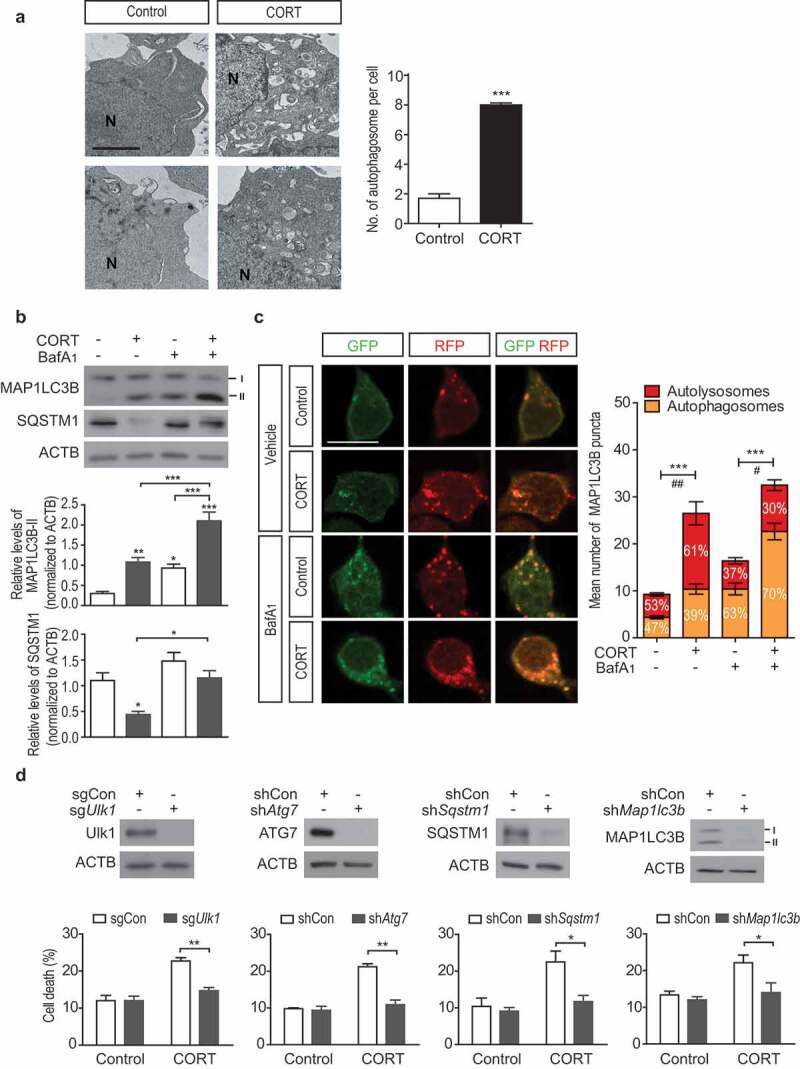
CORT treatment induces ACD in HCN cells. (A) Representative EM images of HCN cells treated with CORT for 48 h. Scale bar: 2 μm. N, nucleus. The graph on the right shows quantification of autophagosomes (n = 35 cells per group). (B) Western blotting analyses of MAP1LC3B and SQSTM1 levels after CORT treatment for 48 h. The graphs on the right show quantification of MAP1LC3B-II (n = 6) and SQSTM1 (n = 4) after normalization to ACTB. (C) Analysis of autophagy flux using mRFP-EGFP-MAP1LC3B after CORT treatment for 48 h. Scale bar: 10 μm. The graph on the right shows quantification of MAP1LC3B puncta (n = 8). ***P < 0.001 for the total MAP1LC3B puncta. #P < 0.05, ##P < 0.01 for yellow puncta. (D) Death rates of HCN cells after KO of Ulk1 (sgUlk1) or with stable knockdown of ATG7 (shAtg7), SQSTM1 (shSqstm1) or MAP1LC3B (shMap1lc3b) in comparison with control cells (sgCon or shCon) after CORT treatment for 48 h (n = 3). In all experiments, BafA1 (20 nM) was added 1 h before cell harvest. *P < 0.05, **P < 0.01, ***P < 0.001.
