Figure 9.

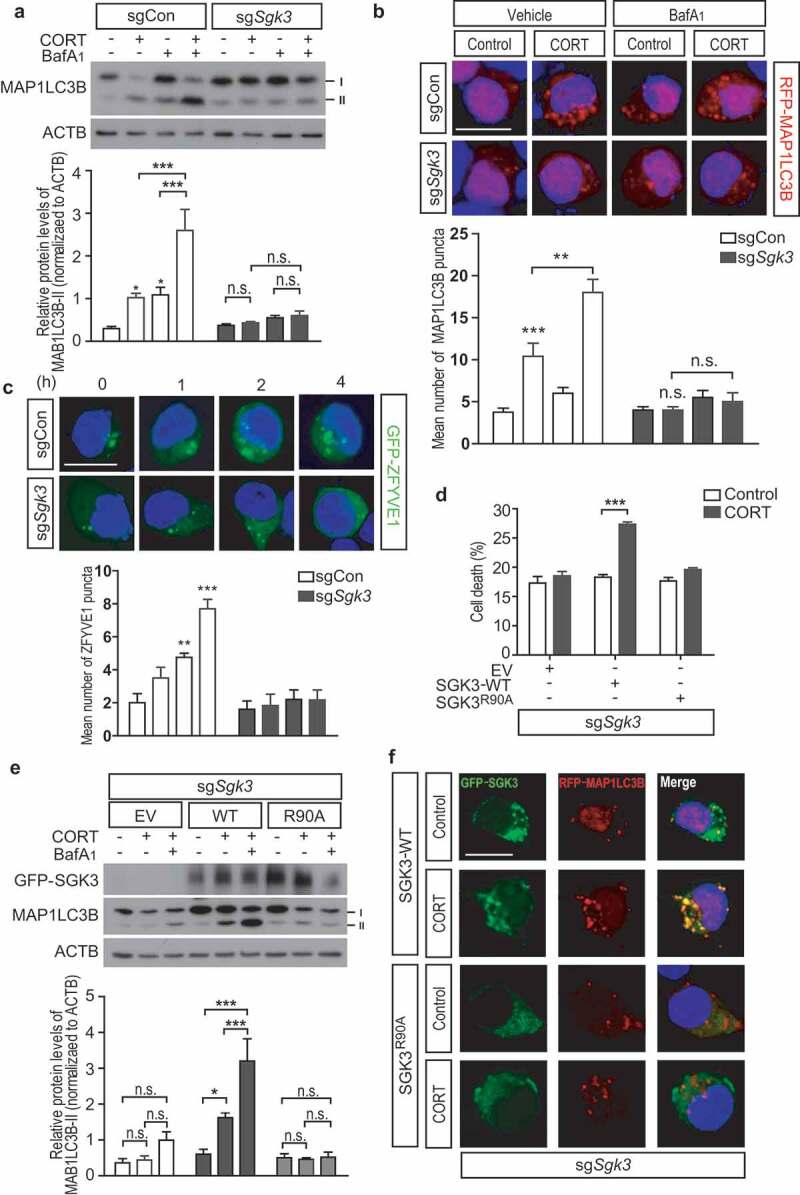
SGK3 mediates ACD in HCN cells following CORT treatment. (A) Analysis of autophagy flux by western blotting of MAP1LC3B. The graph shows quantification of MAP1LC3B-II after normalization to ACTB (n = 5). (B) Analysis of autophagosome formation using mRFP-MAP1LC3B. Scale bar: 10 μm. The graph shows quantification of autophagosomes (n = 4 or 5). (C) Time-course analysis of EGFP-ZFYVE1 puncta formation after CORT treatment using EGFP-ZFYVE1. Scale bar: 10 μm. The graph shows quantification of ZFYVE1 puncta (n = 4–6). (D) Domain diagrams of SGK1, 2, and 3 showing the critical Arg90 residue in the Phox homology (PX) domain in SGK3. SGK1 has an incomplete PX domain [38]. (E) Effects of SGK3 WT and SGK3R90A mutant on sgSgk3 cell death (n = 4). EV, empty vector. (F) Analysis of autophagy flux by western blotting of MAP1LC3B in sgSgk3 cells transfected with SGK3 WT or SGK3R90A mutant. The graph shows quantification of MAP1LC3B-II after normalization to ACTB (n = 3). (G) Effects of the SGK3R90A mutation on the MAP1LC3B puncta formation and colocalization of SGK3 with MAP1LC3B. sgSgk3 cells were co-transfected with EGFP-tagged SGK3 WT or SGK3R90A mutant with mRFP-MAP1LC3B. Scale bar: 10 μm. In all experiments, BafA1 (20 nM) was added 1 h before cell harvest. *P < 0.05, ***P < 0.001. n.s., not significant.
