Figure 5.

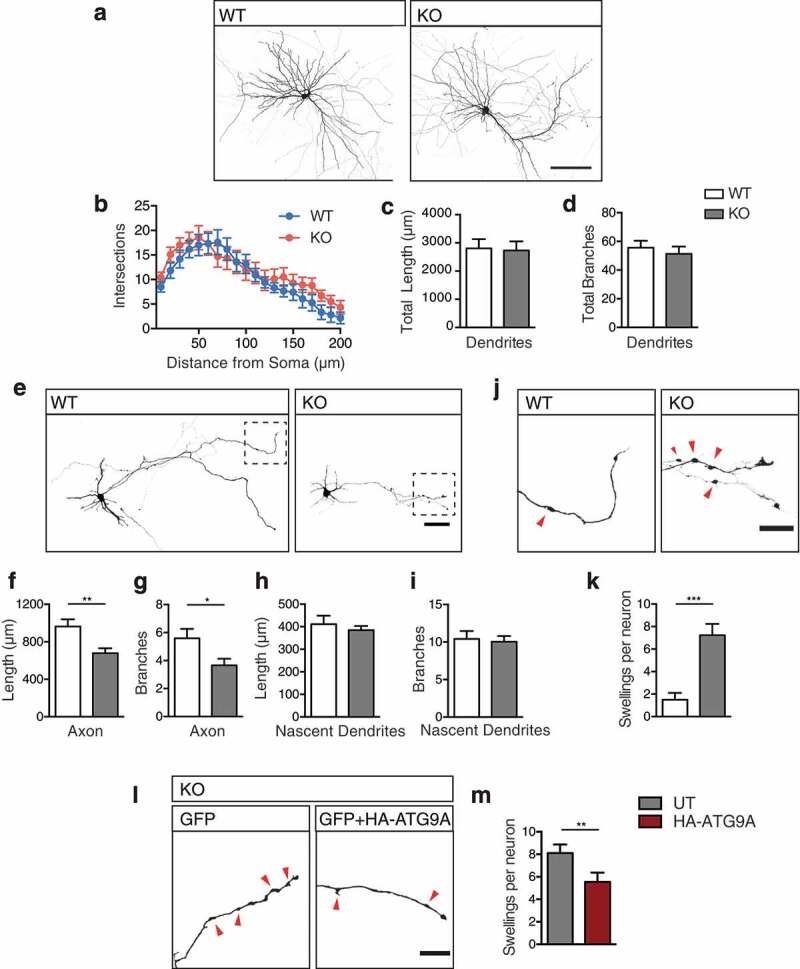
Axon specific defects in ap4e1 KO neurons. (a) Cultured GFP-filled DIV-14 hippocampal neurons stained against GFP showing neuronal morphology. Scale bar: 100 μm. (b) Analysis of dendritic complexity using 10 μm concentric sholl intersections. Quantification of (c) total dendritic length and (d) total branches per neuron (n = 12/17 neurons WT/KO). (e) Cultured GFP-filled DIV-4 hippocampal neurons stained against GFP revealing neuronal morphology and entire axonal extension from individual neurons. Scale bar: 50 μm. (f) Quantification of total axonal length and (g) axonal branches. (n = 22/18 neurons WT/KO). (h) Quantification of nascent dendritic processes in total length and, (i) total branches (n = 22/27 neurons WT/KO). (j) Inset magnified panel from (e) of distal axonal regions, red arrows indicating axonal swellings. Scale bar: 20 μm. (k) Quantification of number of swellings per neuron (n = 20/17 neurons WT/KO). (l) Distal axonal regions of KO neurons transfected with GFP alone, or in combination with HA-ATG9A, showing a reduction in the number of axonal swellings upon expression of ATG9A, scale bar: 20 μm, (m) Quantification of number of swellings per neuron (n = 29/26 neurons WT/KO). Quantified data is expressed as mean ± SEM. Statistical analysis: (b) Two-way ANOVA with Bonferroni post-hoc test, (c, d, f, h and i) Two-tailed unpaired Student’s t-test, (g, k and m) Two-tailed Mann-Whitney U test, *p < 0.05, **p < 0.01 and ***p < 0.001.
