Figure 5.

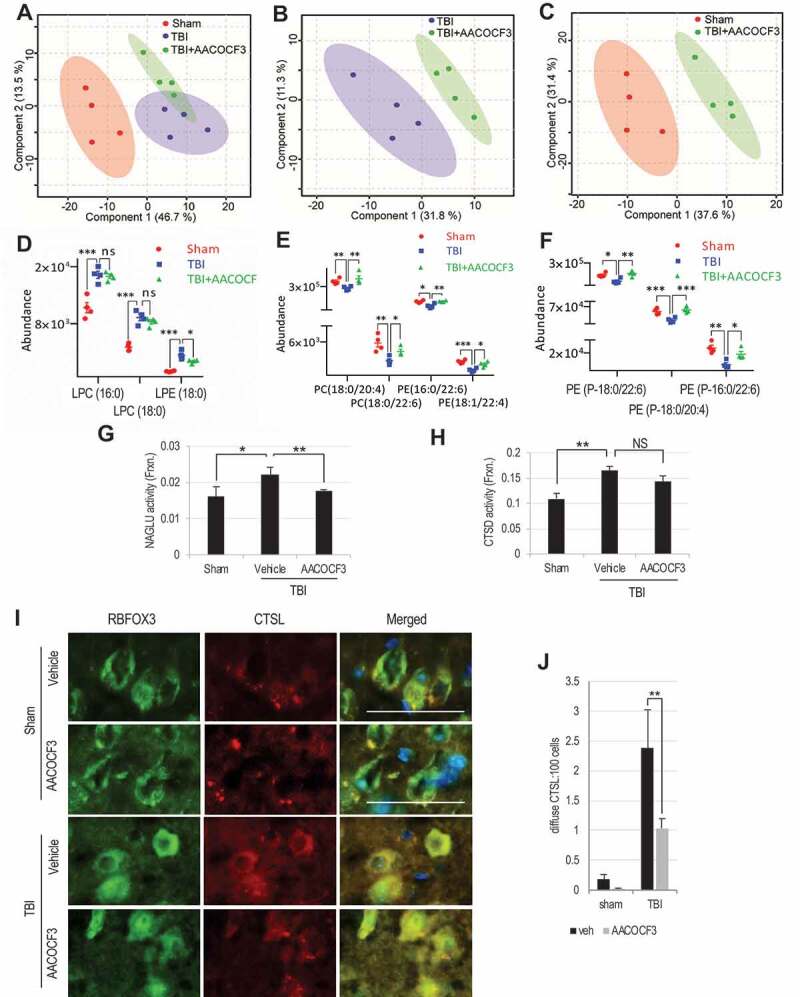
PLA2G4A inhibition normalizes lysosomal membrane lipid composition and attenuates lysosomal membrane permeabilization after TBI.
(A-C) Comparison of positive ion mode UPLC-HDMS of lysosomal membrane prepared from the cortices of sham, TBI and TBI+AACOCF3 using Partial Least Squares – Discriminate Analysis (PLS-DA) plot. Each point represents data set from an individual animal; sham (red), TBI (blue), TBI+AACOCF3 (green). The 95% confidence intervals are indicated by elliptical shaded areas surrounding each group. (A) PLS-DA plot comparing Sham, TBI, and TBI+AACOCF3 in positive ion mode UPLC-HDMS; R2 = 0.97, Q2 = 0.32. (B) PLS-DA plot comparing TBI and TBI+AACOCF3 in positive ion mode UPLC-HDMS; R2 = 0.92, Q2 = 0.34. (C) PLS-DA plot comparing Sham and TBI+AACOCF3 in positive ion mode UPLC-HDMS; R2 = 0.95, Q2 = 0.64. Data were sum normalized, log transformed, and mean centered. n = 4 animals/group. Plots generated using MetaboAnalyst. (D-F) Abundance of specific classes of phospholipids is normalized in the lysosomal membranes from AACOCF3 treated TBI mice as compared to vehicle treated TBI controls. Individual data points as well as mean ± SEM are indicated. Sham (red), TBI (blue), and TBI+AACOCF3 (green). n = 4 animals/group. (D) LPC/LPE abundance. Calculated p-values for TBI to TBI+AACOCF3 were 0.7124 (LPC(16:0)), 0.3140 (LPC(18:0)), and 0. 0366 (LPE(18:0)). (E) PC/PE abundance. Calculated p-values for TBI to TBI+AACOCF3 were 0.0253 (PC(18:0/20:4)), 0.0224 (PC(18:0/22:6)), 0.0071 (PE(16:0/22:6)), and 0.0130 (PE(18:1/22:4)). (F) Ether PE abundance. Calculated p-values for TBI to TBI+AACOCF3 were 0.0074 (PE(P-18:0/22:6)), 0.0020 (PE(P-18:0/20:4)), and 0.0209 (PE(P-18:0/22:6)). (G and H) Activity of lysosomal enzymes (G) NAGLU and (H) CTSD in the cytosolic fraction from sham and TBI mouse cortices. Data are mean ± SEM, n = 8–10 animals/group; *p < 0.05, **p < 0.01 (One-way ANOVA with Turkey’s multiple comparison test). (I-J) IF analysis demonstrating decreased cytoplasmic leakage of CTSL in TBI+AACOCF3 as compared to TBI cortex. (I) Images (20×) of cortical brain sections from sham, sham+AACOCF3, TBI and TBI+AACOCF3 mice stained with antibodies against neuronal marker RBFOX3/NeuN (green) and CTSL (red). Scale bar: 50 μm (J) Corresponding quantification of cells with diffused (cytosolic) CTSL staining. Data are mean ± SEM, n = 3 for vehicle or AACOCF3 treated sham and 5 for vehicle or AACOCF3 treated TBI mice; *p < 0.05, (Two-way ANOVA with Bonferroni posttests).
