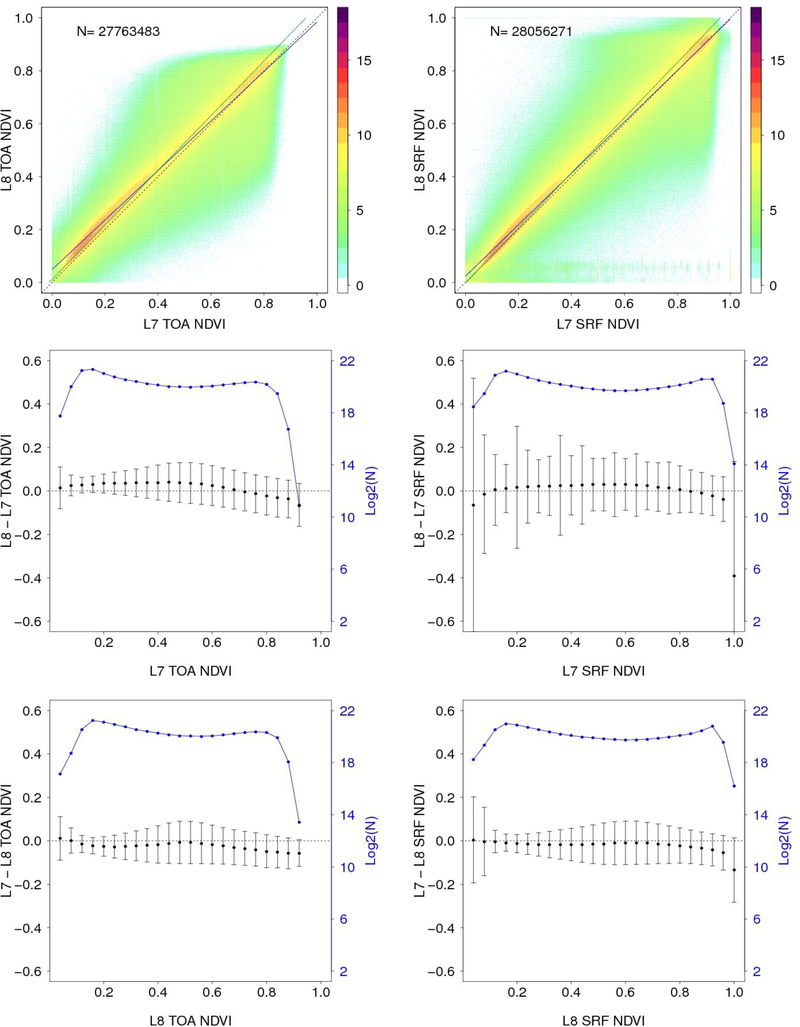
Figure 9.
TOA (left) and surface (right) NDVI comparisons derived from the filtered results shown in Figures 7 and 8 respectively. Top row: Sensor NDVI scatterplots considering NDVI values in the range 0 to 1; the blue lines show ordinary least squares (OLS) regression of the OLI against the ETM+ data, the green lines shows OLS regression of the ETM+ data against the OLI data, and the dotted lines are 1:1 lines superimposed for reference. Middle and Bottom rows: mean (black solid circles) ±one standard deviation (black vertical lines) sensor NDVI differences for contiguous 0.04 NDVI ranges. The number of NDVI values considered (log2 scale) is shown in blue (right Y-axis).

