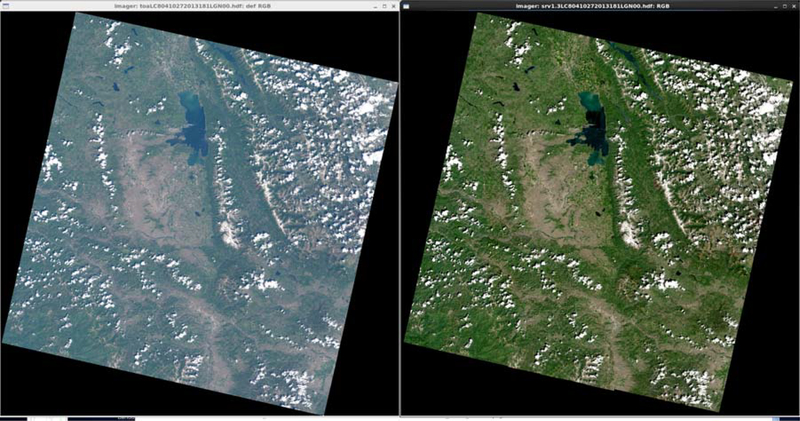
Figure 1:
Landsat 8/OLI RGB composite (Red Band 4, Green Band 3, Blue Band 2), over Missoula, MT, acquired on June 30, 2013. The left side corresponds to the reflectance at the top of the atmosphere, the right side to the surface reflectance. The “color stretch” used for both sides is the same. The logarithm of the reflectance in each band is scaled linearly between 5 (digital count 0) and 8.5 (Digital count 255).

