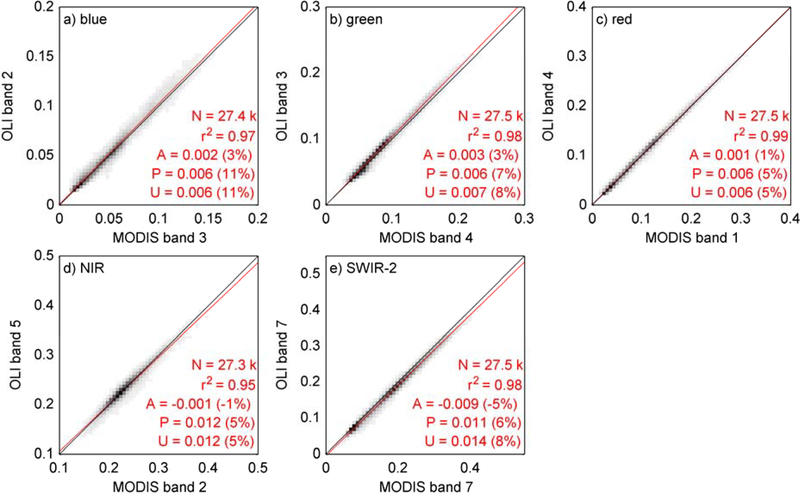
Figure 7:
Cross-comparison between Aqua MODIS BRDF and spectrally adjusted SR CMG product and OLI SR aggregated over the CMG. The five subplots correspond to five OLI spectral bands used for the cross-comparison. Plots are represented through density functions from light gray (minimum) to black (maximum); white means no data. Red lines correspond to the linear fits. r2, A, P and U refer to the statistical metrics given in Section 4. Relatives A, P and U are reported in parentheses. N is the number of points.

