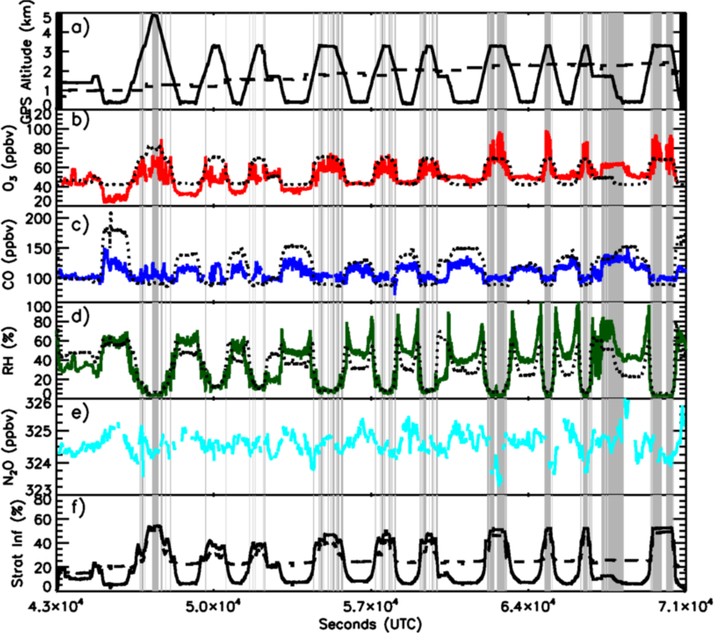
Figure 3.
Aircraft observations from the P-3B on July 14, 2011 taken from 12 to 20 UTC. Panel (a) shows aircraft altitude (black, km) overlaid with GEOS-5 diagnosed PBL height (dashed, km). Observed ozone (red, ppbv) and MERRA-2 ozone (black dotted; ppbv) are shown in (b). GEOS-5 simulated (dotted) and observed CO (blue, ppbv) are shown in panel (c). Simulated (dotted) and observed relative humidity (green, %) are shown in panel (d) while observed N2O (cyan, ppbv) is plotted in (e). Time series of the GEOS-5 stratospheric tracers (%) are shown in panel (f) with the solid line indicating the influence tracer and dashed line showing the July 1–14 pulse tracer. Gray shaded areas indicate periods when ozone was more than one standard deviation greater than the mean value for the flight.

