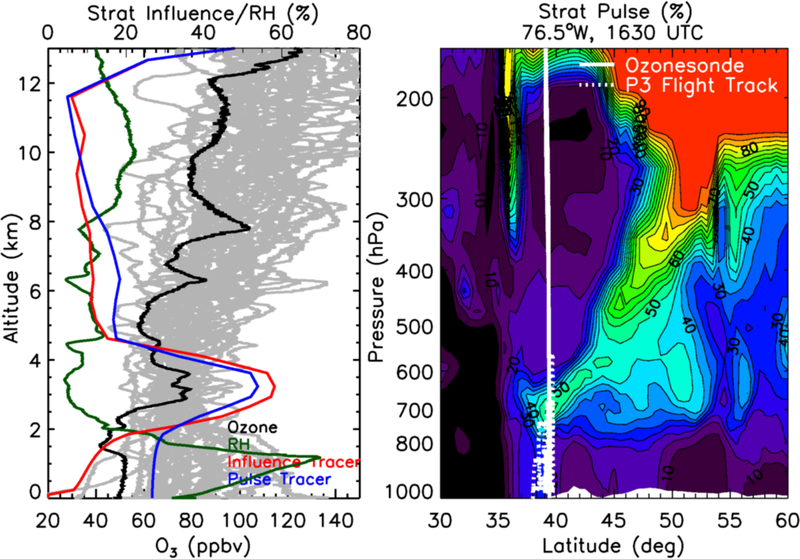
Figure 9.
July 27 ozonesonde measurements (left panel) from Edgewood taken at 1500 UTC (black). Gray lines indicate all ozonesonde measurements taken during DISCOVER-AQ while green lines show observed relative humidity from the July 27 sonde. GEOS-5 stratospheric influence tracers sampled at the same locations are shown in red (with surface reset) and blue (pulse tracer without surface reset). Right panel shows GEOS-5 stratospheric pulse tracer cross section at the longitude of Maryland. Dotted white line shows the latitude and altitude of the July 27 P-3B flight (Figure 8) while the solid white line shows the location of ozonesonde measurements taken at Edgewood, MD. Colors indicate the fraction of air that had been in the stratosphere between July 15 and 27.

