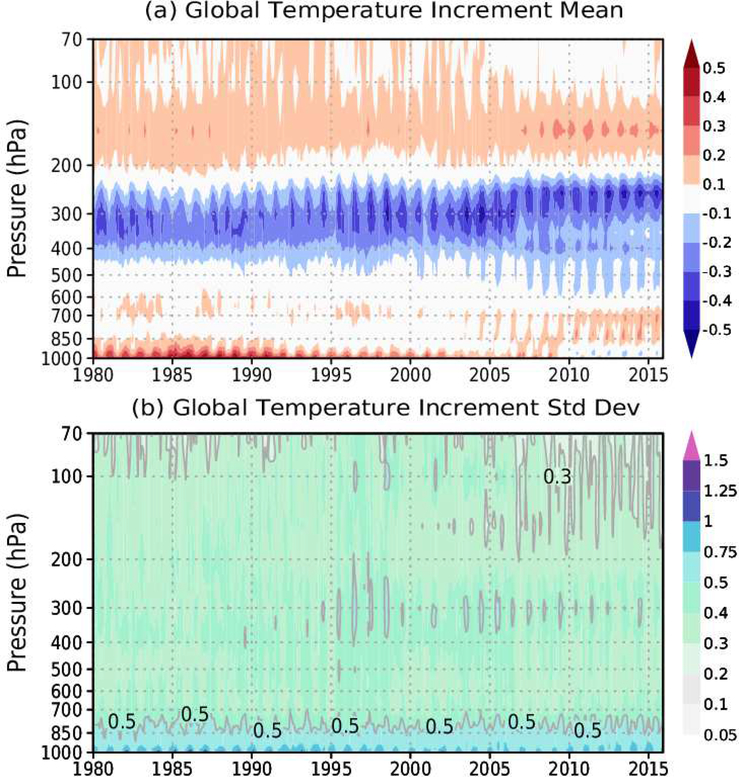
Figure 10:
Global (a) mean and (b) standard deviation of the monthly mean analysis tendency of temperature from 1000 to 70 hPa. Monthly means values are based on four synoptic times daily. The units are K day−1. Results are derived from the data collection described in GMAO (2015n).

