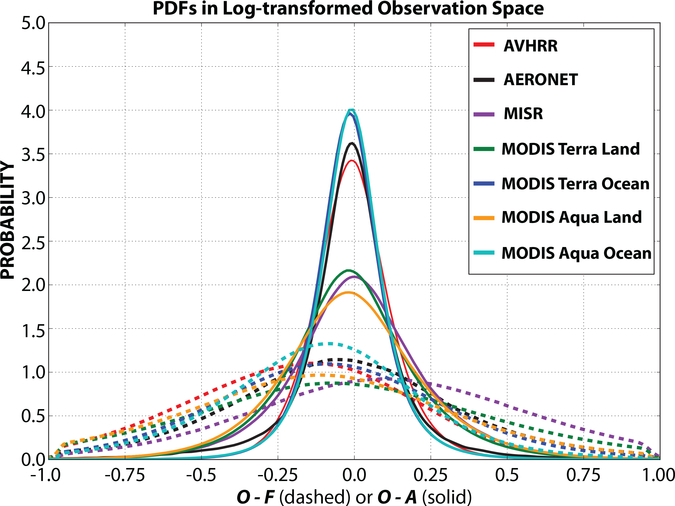
Figure 12:
Probability distribution functions (PDFs) of observation minus forecast (O-F, dashed) and observation minus analysis (O-A, solid) differences in observation space, collocated in space and time for each sensor in the MERRA-2 aerosol observing system. The PDFs are calculated from innovation data in log-transformed space (ln(AOD+0.01)) to ensure distributions are positive and Gaussian. The time periods considered include AVHRR (1993–1999), MODIS Terra (2001–2014), MODIS Aqua (2003–2014), MISR (2001–2012), and AERONET (ANET 2000–2013).

