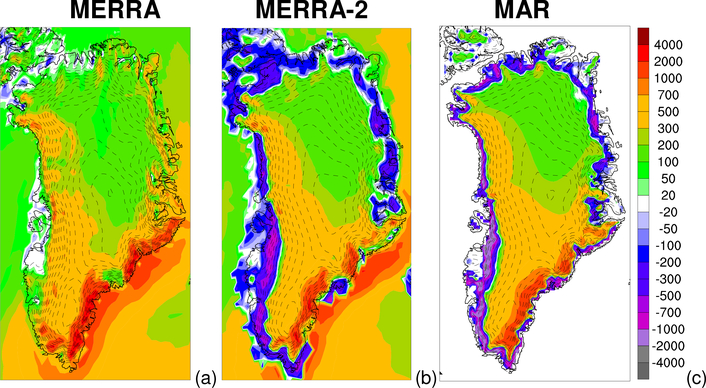
Figure 26:
Surface mass balance for the Greenland Ice Sheet for the period 1980–2012 in (a) MERRA, (b) MERRA-2, and (c) MAR regional climate model (Fettweis 2007). The units are mm yr−1 water-equivalent. Surface topography (including ice sheet) is contoured with dashed lines every 200 m. Results for MERRA-2 are derived from the data collections described in GMAO (2015i, j, m).

