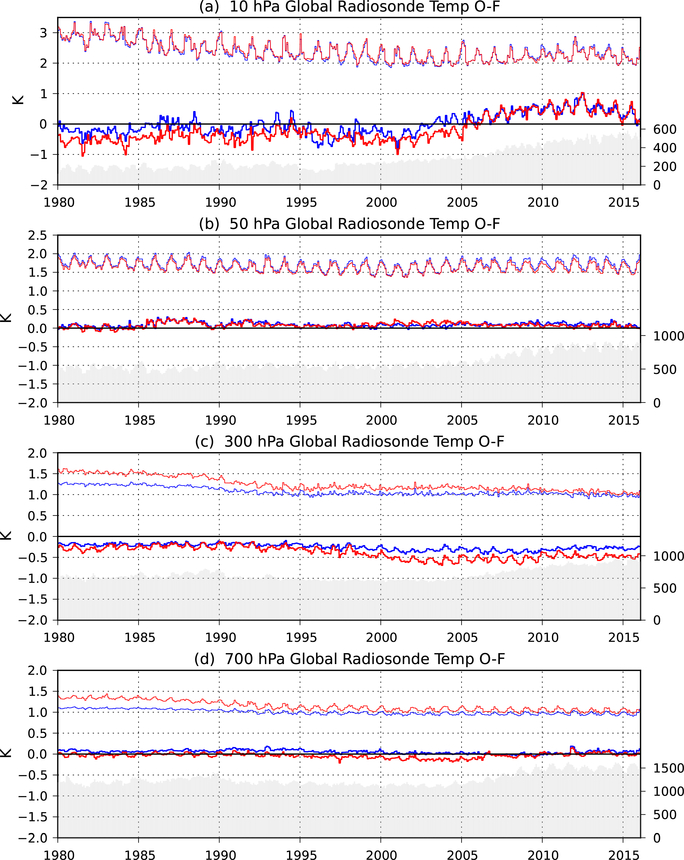
Figure 7:
Global monthly mean (thick lines) and RMS (thin lines) background departures for radiosonde temperature observations assimilated in MERRA (blue) and MERRA-2 (red). Results are shown for the pressure levels (a) 10 hPa, (b) 50 hPa, (c) 300 hPa and (d) 700 hPa. The units are K. Also shown are the corresponding monthly mean counts of radiosonde temperature observations assimilated in MERRA-2 (gray shaded).

