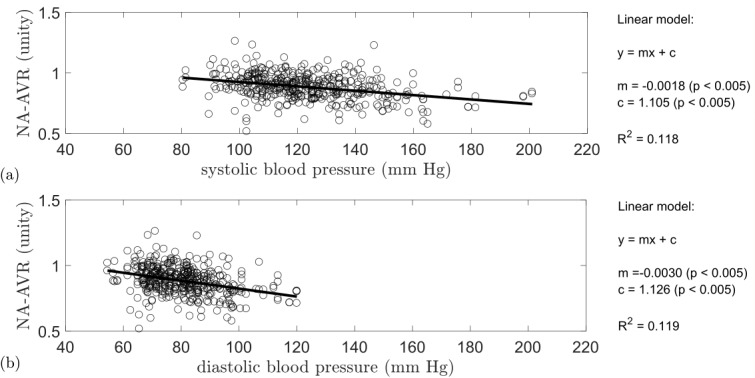
Figure 2.

NA-AVR plotted against (A) systolic blood pressure (mm Hg) and (B) diastolic blood pressure (mm Hg). Also given is a linear model fitted to the data with corresponding R2 value. A reduction in NA-AVR was observed with increasing systolic and diastolic blood pressures. NA-AVR, nasal–annular arteriole:venule ratio.
