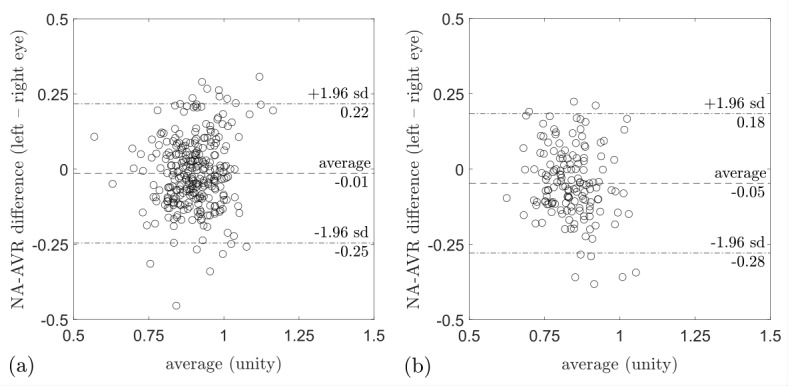
Figure 4.

Bland-Altman plot for (A) NA-AVR in normotension and (B) in hypertension. The y-axis shows the difference in NA-AVR between left and right eyes, while the x-axis is the average of NA-AVR for each eye pair. In both normotension and hypertension, NA-AVR is smaller for the left eye compared with the right eye. The data points in (B) are further to the left compared with those in (A), indicating smaller NA-AVR in hypertension compared with normotension. NA-AVR, nasal–annular arteriole:venule ratio.
