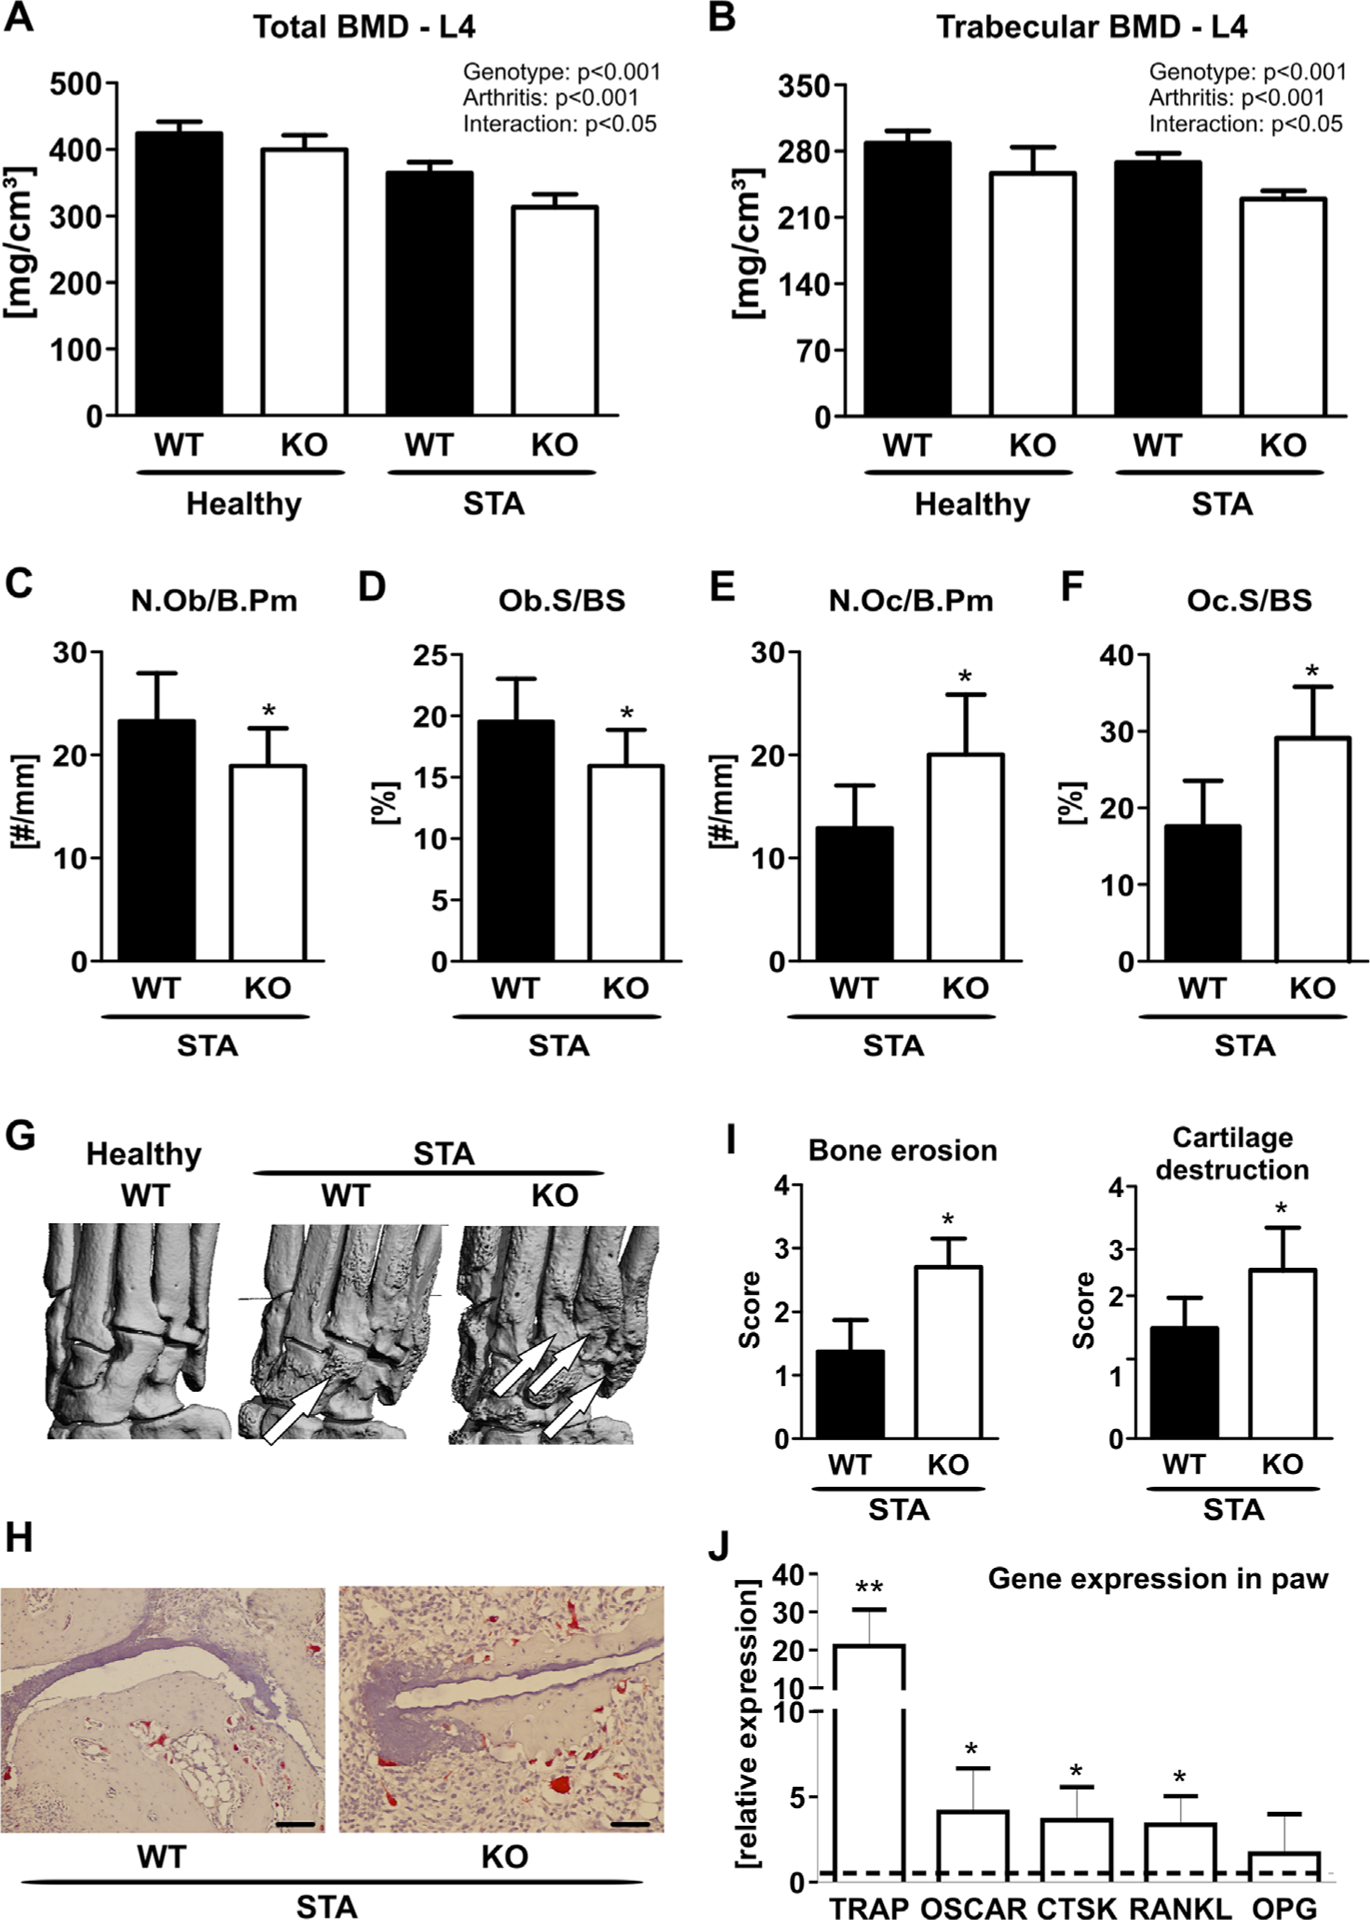
Fig. 5.

Loss of MFG-E8 is associated with more severe arthritis-induced bone loss. Peripheral quantitative computed tomography (pQCT) was performed to analyze (A) the total and (B) the trabecular bone mineral density (BMD) at the fourth lumbar vertebra. (C–F) Histology from the paws of K/BxN arthritic WT and MFG-E8 knock-out (KO) mice showing (C) osteoblast number per bone perimeter (N.Ob/B.Pm), (D) osteoblast surface per bone surface (Ob.S/BS), (E) osteoclast number per bone perimeter (N.Oc/B.Pm), and (F) osteoclast surface per bone surface (Oc.S/BS). (G) Local bone erosions were visualized using μCT. Arrows indicate areas of extensive bone erosions. (H) Representative TRAP staining of the paws of arthritic WT and MFG-E8 KO mice. Scale bar = 20 μm. (I) Quantification of bone erosions and cartilage integrity on TRAP-stained sections of the paw. (J) RNA was isolated from the paws. qPCR analyses was performed for osteoclast-related genes (TRAP = tartrate-resistant acid phosphatase; OSCAR = osteoclast-associated receptor; CTSK = cathepsin K; RANKL = receptor activator of NF-κB ligand; OPG = osteoprotegerin) in paws from MFG-E8 KO (white bars) compared with gene expression in paws from WT mice (dashed line). n = 7–9 per group. *p < 0.05; **p < 0.01; ***p < 0.001. ##p < 0.01 versus healthy; ###p < 0.001 versus healthy.
