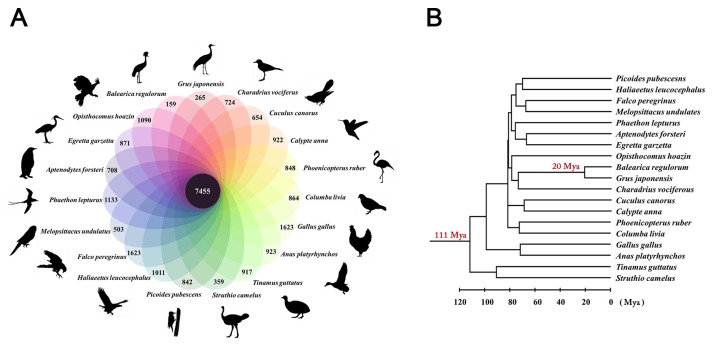
Fig. 1. Orthologous gene clusters of the red-crowned crane compared to the other avian species.
(A) The Venn diagram shows the number of unique (number in the ovals) and shared (the number in the center black circle) gene families analyzed by OrthoMCL (Li et al., 2003). It was drawn manually using the online photo editor (https://pixlr.com/editor/). (B) Divergence time of the red-crowned-crane and grey-crowned crane (Hedges et al., 2015).

