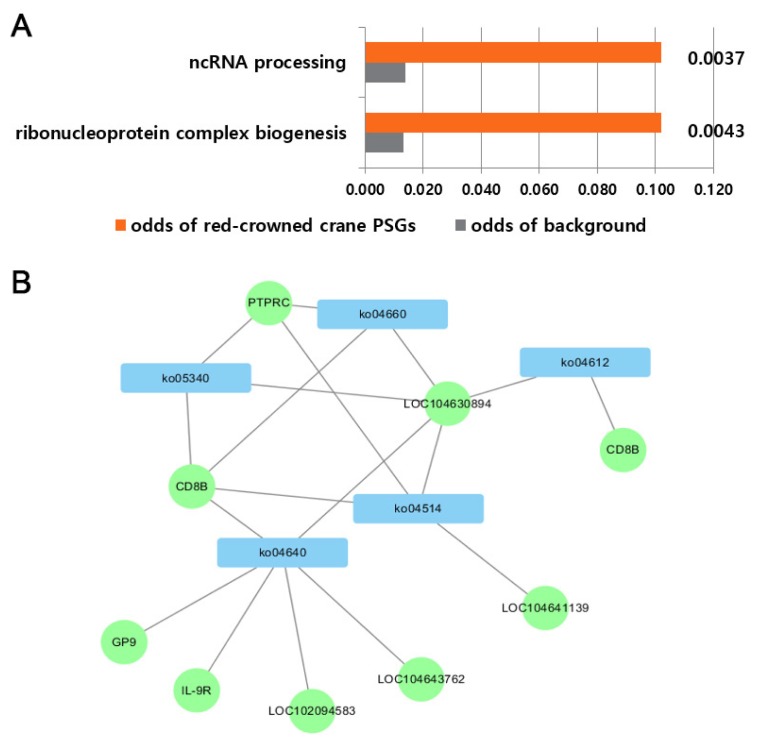
Fig. 2. Functional analysis of the red-crowned crane PSGs.
(A) Red-crowned crane PSGs enriched in GO categories. The values to the right of the bar represent the p-values from the enrichment test analyzed on the DAVID website (Huang et al., 2008). (B) Network diagram of the red-crowned crane PSGs associated with KEGG pathways. The blue rectangles represent pathway IDs from the KEGG database and the green circles represent the red-crowned crane PSGs. Each edge represents the association between the pathways and the genes.

