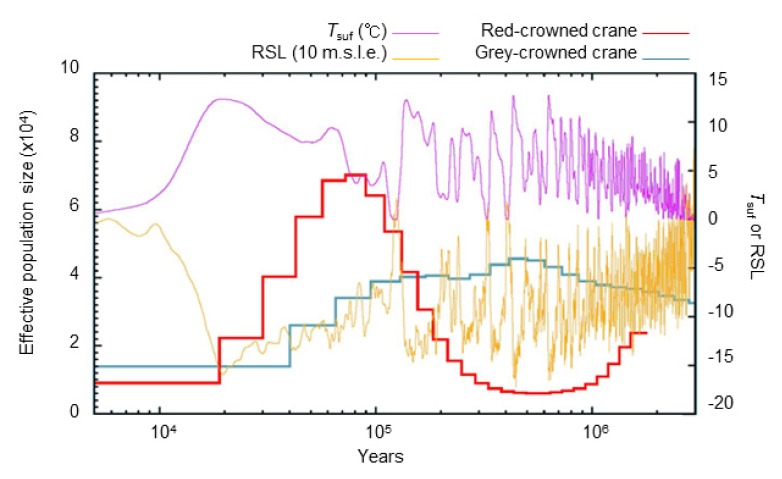
Fig. 3. Demographic history of the red-crowned crane and grey-crowned crane.
PSMC demographic modeling of the red-crowned crane, using a generation time (g = 12.3 years) and mutation rate per generation time (μ = 9.66 × 10⁻⁹), and the grey-crowned crane, with a generation time (g = 15.1) and mutation rate (μ = 1.18 × 10⁻⁸). Tsuf, atmospheric surface air temperature; RSL, relative sea level; 10 m.s.l.e., 10 m sea level equivalent.

