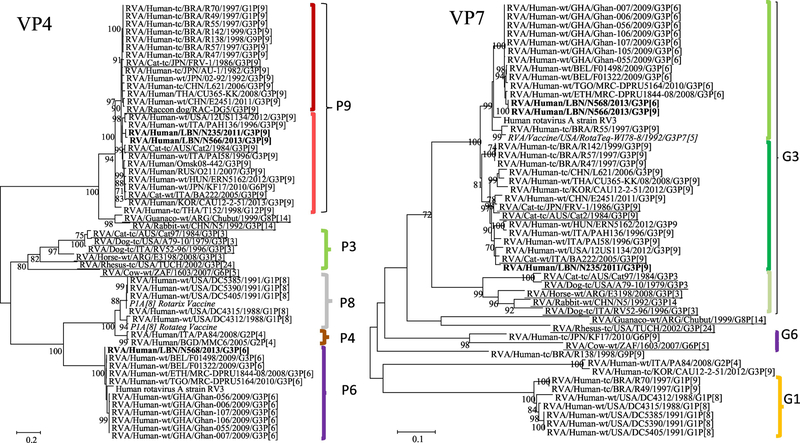
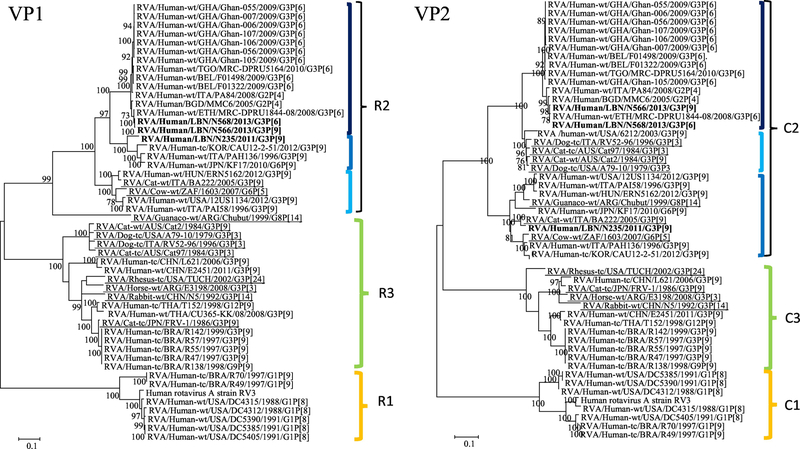
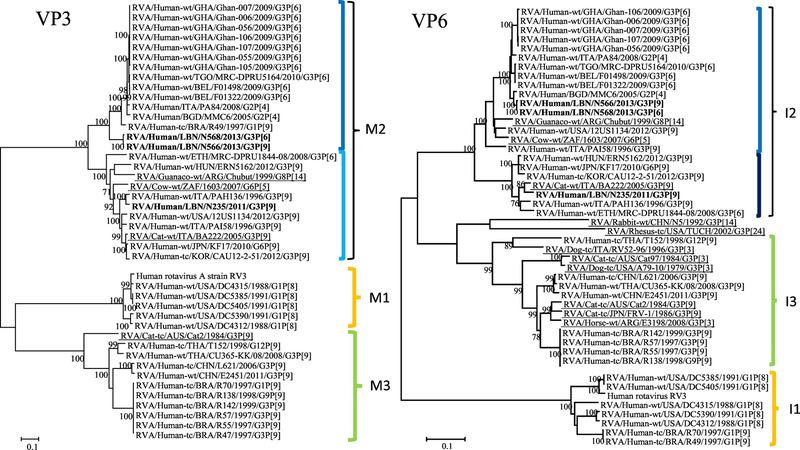
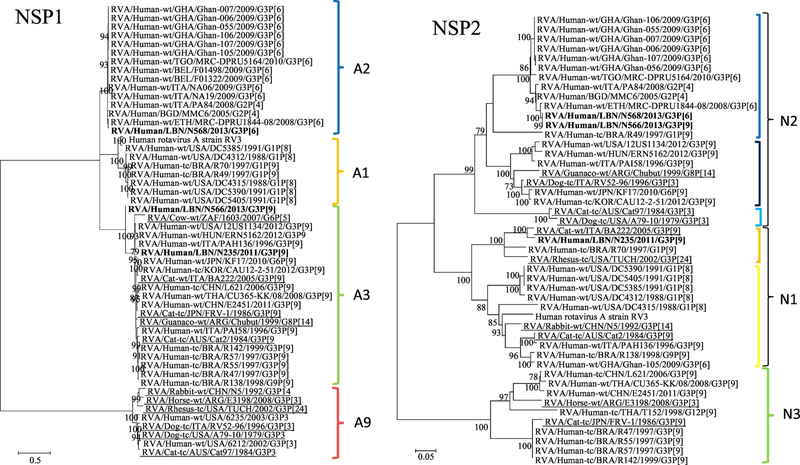
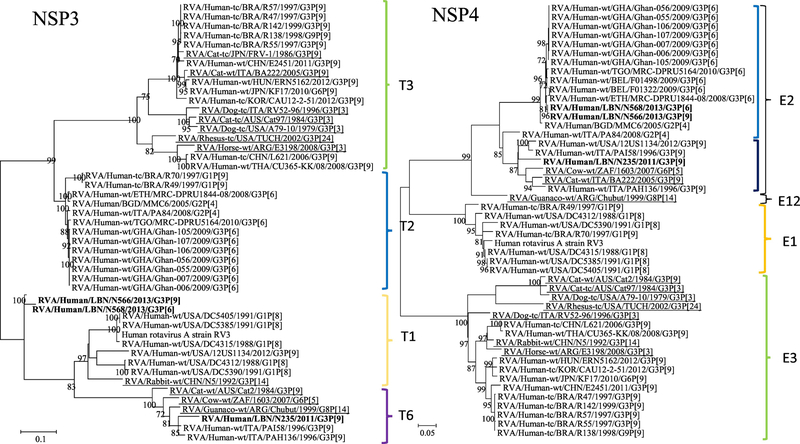
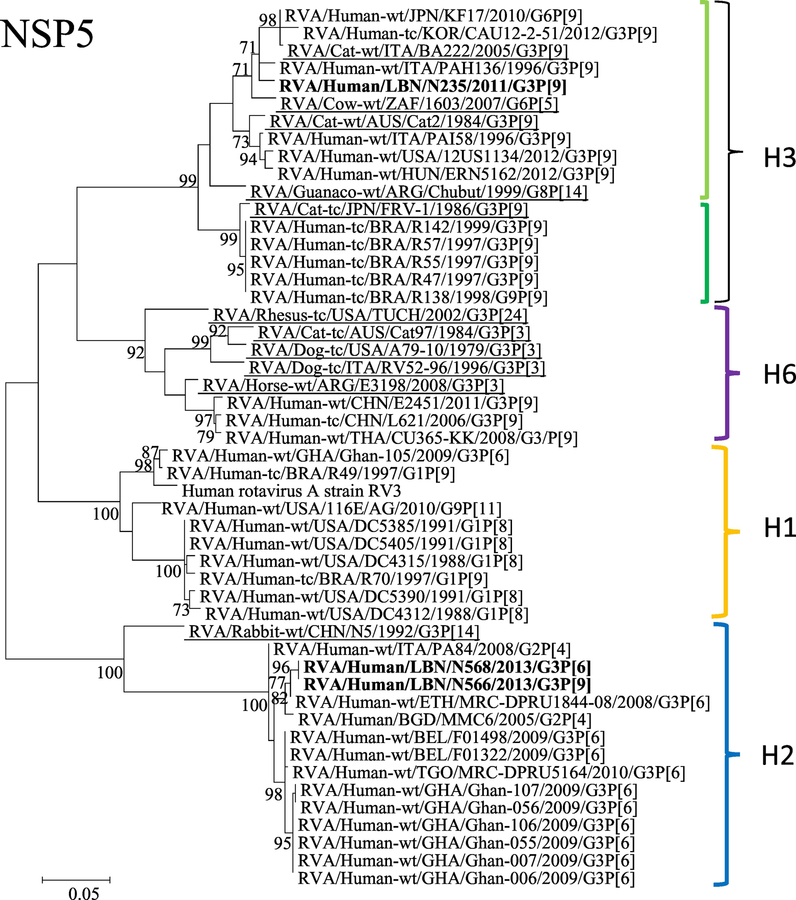
Figure 1.
Phylogenetic trees of the 11 gene segments of the Lebanese G3 RVA strains and representative RVA strains. The phylogenetic trees were inferred using the maximum-likelihood analysis based on the best-fit nucleotide substitution model for each individual gene. The Lebanese strains are bolded, whereas those of the animal and vaccine strains are underlined and italicized, respectively. Brackets and colored tones are used to show the clustering patterns in the phylogenetic trees. Bootstrap values equal or greater than 70% are shown. Scale bars indicate the substitutions per nucleotide.

