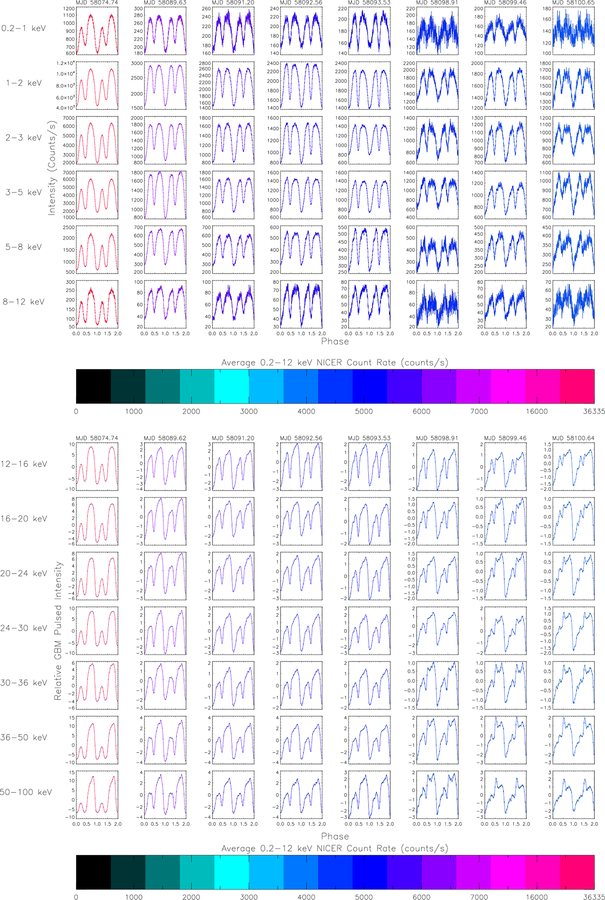
Figure A.3.
(Top panel): Swift J0243.6+6124 pulse profiles from NICER observations in 6 energy bands. Profiles are arbitrarily aligned so that the minimum of the 0.2–12 keV profile is at phase 0.0. (Bottom panel) Swift J0243.6+6124 1-day pulse profiles measured with GBM in 7 energy bands. Profiles are arbitrarily shifted so that the minimum in the GBM 8–12 keV band (not shown) is at phase zero. (Both panels): The NICER and GBM profiles are color coded using average NICER 0.2–12 keV count rate for each observation. The NICER and GBM profiles are folded with the same ephemeris, using the epoch in MJD that is the title of each column. This figure includes MJD 58074.7–58100.6, the beginning of the declining phase of the outburst.

